Predictor
Important
The Predictor tool is only available to users with the Varicent Advanced Algorithm Library subscription add-on. If you are interested in using this tool, please contact your Varicent Customer Success Manager.
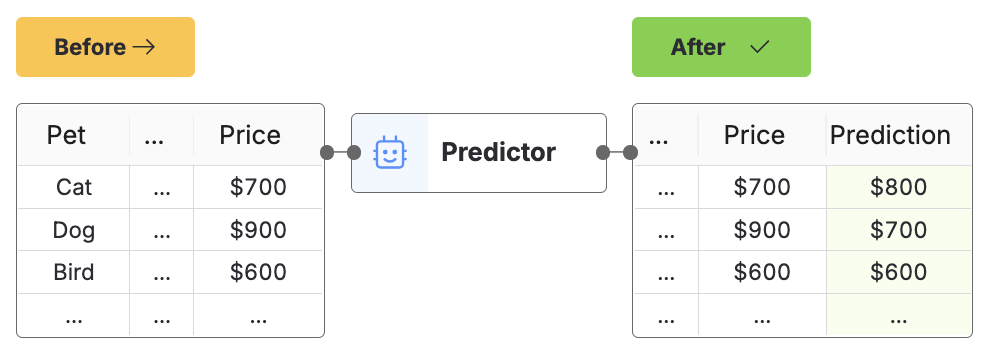
The Predictor tool trains the model to predict a column with a set of values.
The Predictor first determines if the problem looks like a classification or a regression. If it does, then this tool considers all classification modeling tools and regression modeling tools. Varicent ELT uses the tool with the best score to make a prediction.
Note
The speed and quality slider is more of a spectrum. This setting determines the number of machine learning models considered. Models that do not support the training data are automatically excluded.
This tool adds two columns to your data: a prediction and a probability. It's the model's certainty about the prediction.
When you run the tool, the data is automatically split: 80% of the data is used for training. The remaining 20% is used for testing. Each model being considered is trained and evaluated to select the one with the best score. This is done 5 times to predict the test values (the 20% of your data). The final score is the average of all 5 scores.
Tip
You can configure this tool without using the configuration menu.
In the menu, start typing the first few letters of the tool name and press tab to auto-complete. Then start typing the name of the column you want to use and press tab to auto-complete.
Data profile chart visuals
From the Row viewer, you can access the Data profile link to open the column details and compare column visuals.
From the Row viewer, you can access the Data profile link to open the column details and compare column visuals. The results are available when you select one of the Classifier, Predictor or Regressor tools.
In your selected pipe, go to the Row viewer.
Click on the Data profile link in the row viewer.
The Data profile page opens with column details and compare column visuals.
Note
If you have an explainable tool upstream, you can still get an error message with one of the following issues:
The schema has changed in the export. For example, a missing column or an extra column is present.
There are multiple explainable tools in the pipe upstream.
The pipe changed, and the calculation is now invalid.
If there is no Data profile link, no explainable tool is selected in the upstream pipe.
When to use this tool
Use this when you want to make a prediction, but you're unfamiliar with classification and regression modelling tools. After you're comfortable with the difference between those tools, switch to using the Regressor or Classifier tool.
What is Smart exclude?
Following a successful build using the Predictor tool, Smart exclude identifies and automatically excludes columns that don’t help predict the target column. Smart exclude will only consider columns not already manually excluded. If you want to disable this setting to troubleshoot, test, or run a calculation that is taking too long, go to the Advanced settings under the Configure tab.
Configuration
Use the following configuration options to configure the Predictor tool.
Go to the Pipes module from the side navigation bar.
From the Pipes tab, click an existing pipe to open, or create a new pipe. To create a new pipe, read the Creating a pipe documentation.
In the Pipe builder, add a data source to your pipe. For more information on adding a data source, see the Data Input tool.
Click
 + Tool.
The Tools modal opens, where you can add tools, such as the Aggregate tool, to your pipe.
In the Tools modal, search for Predictor, and then click + Add Tool.
Tip
You can also find the Predictor tool in the Learn section.
Click the tool node and drag the line to the next tool to connect the tools. If you need to undo the action, click the line and then click Unlink.
In the configuration pane, under Target column, select the column that you want to use the Predictor on.
Expand the Advanced section, and move the Speed vs Quality slider to indicate if you want speed or quality when the predictor is working.
Under Exclude columns, select the columns that you want to exclude from the prediction.
Click Smart exclude if you want to have Smart Exclude identify and automatically exclude columns that don’t help predict the target column after you build.
Click Reset to default, if you want to start over.
Click on the tool name to rename your tool node to a meaningful name. Name your tools in a way that describes the function, not the object or the data action. For example, use “Look up rate” instead of “Join to rate table”.
Usage example
For example, you want to predict customer churn based on historical data. The dataset that you're working with includes various attributes about customers and whether they have already churned or not.
Using the dataset, the Churned column is the one that we want to use to predict. We want the tool to analyze the data and model dependencies between the Age, Tenure, LastTransactionAmount, and other columns to predict the churn for a customer.
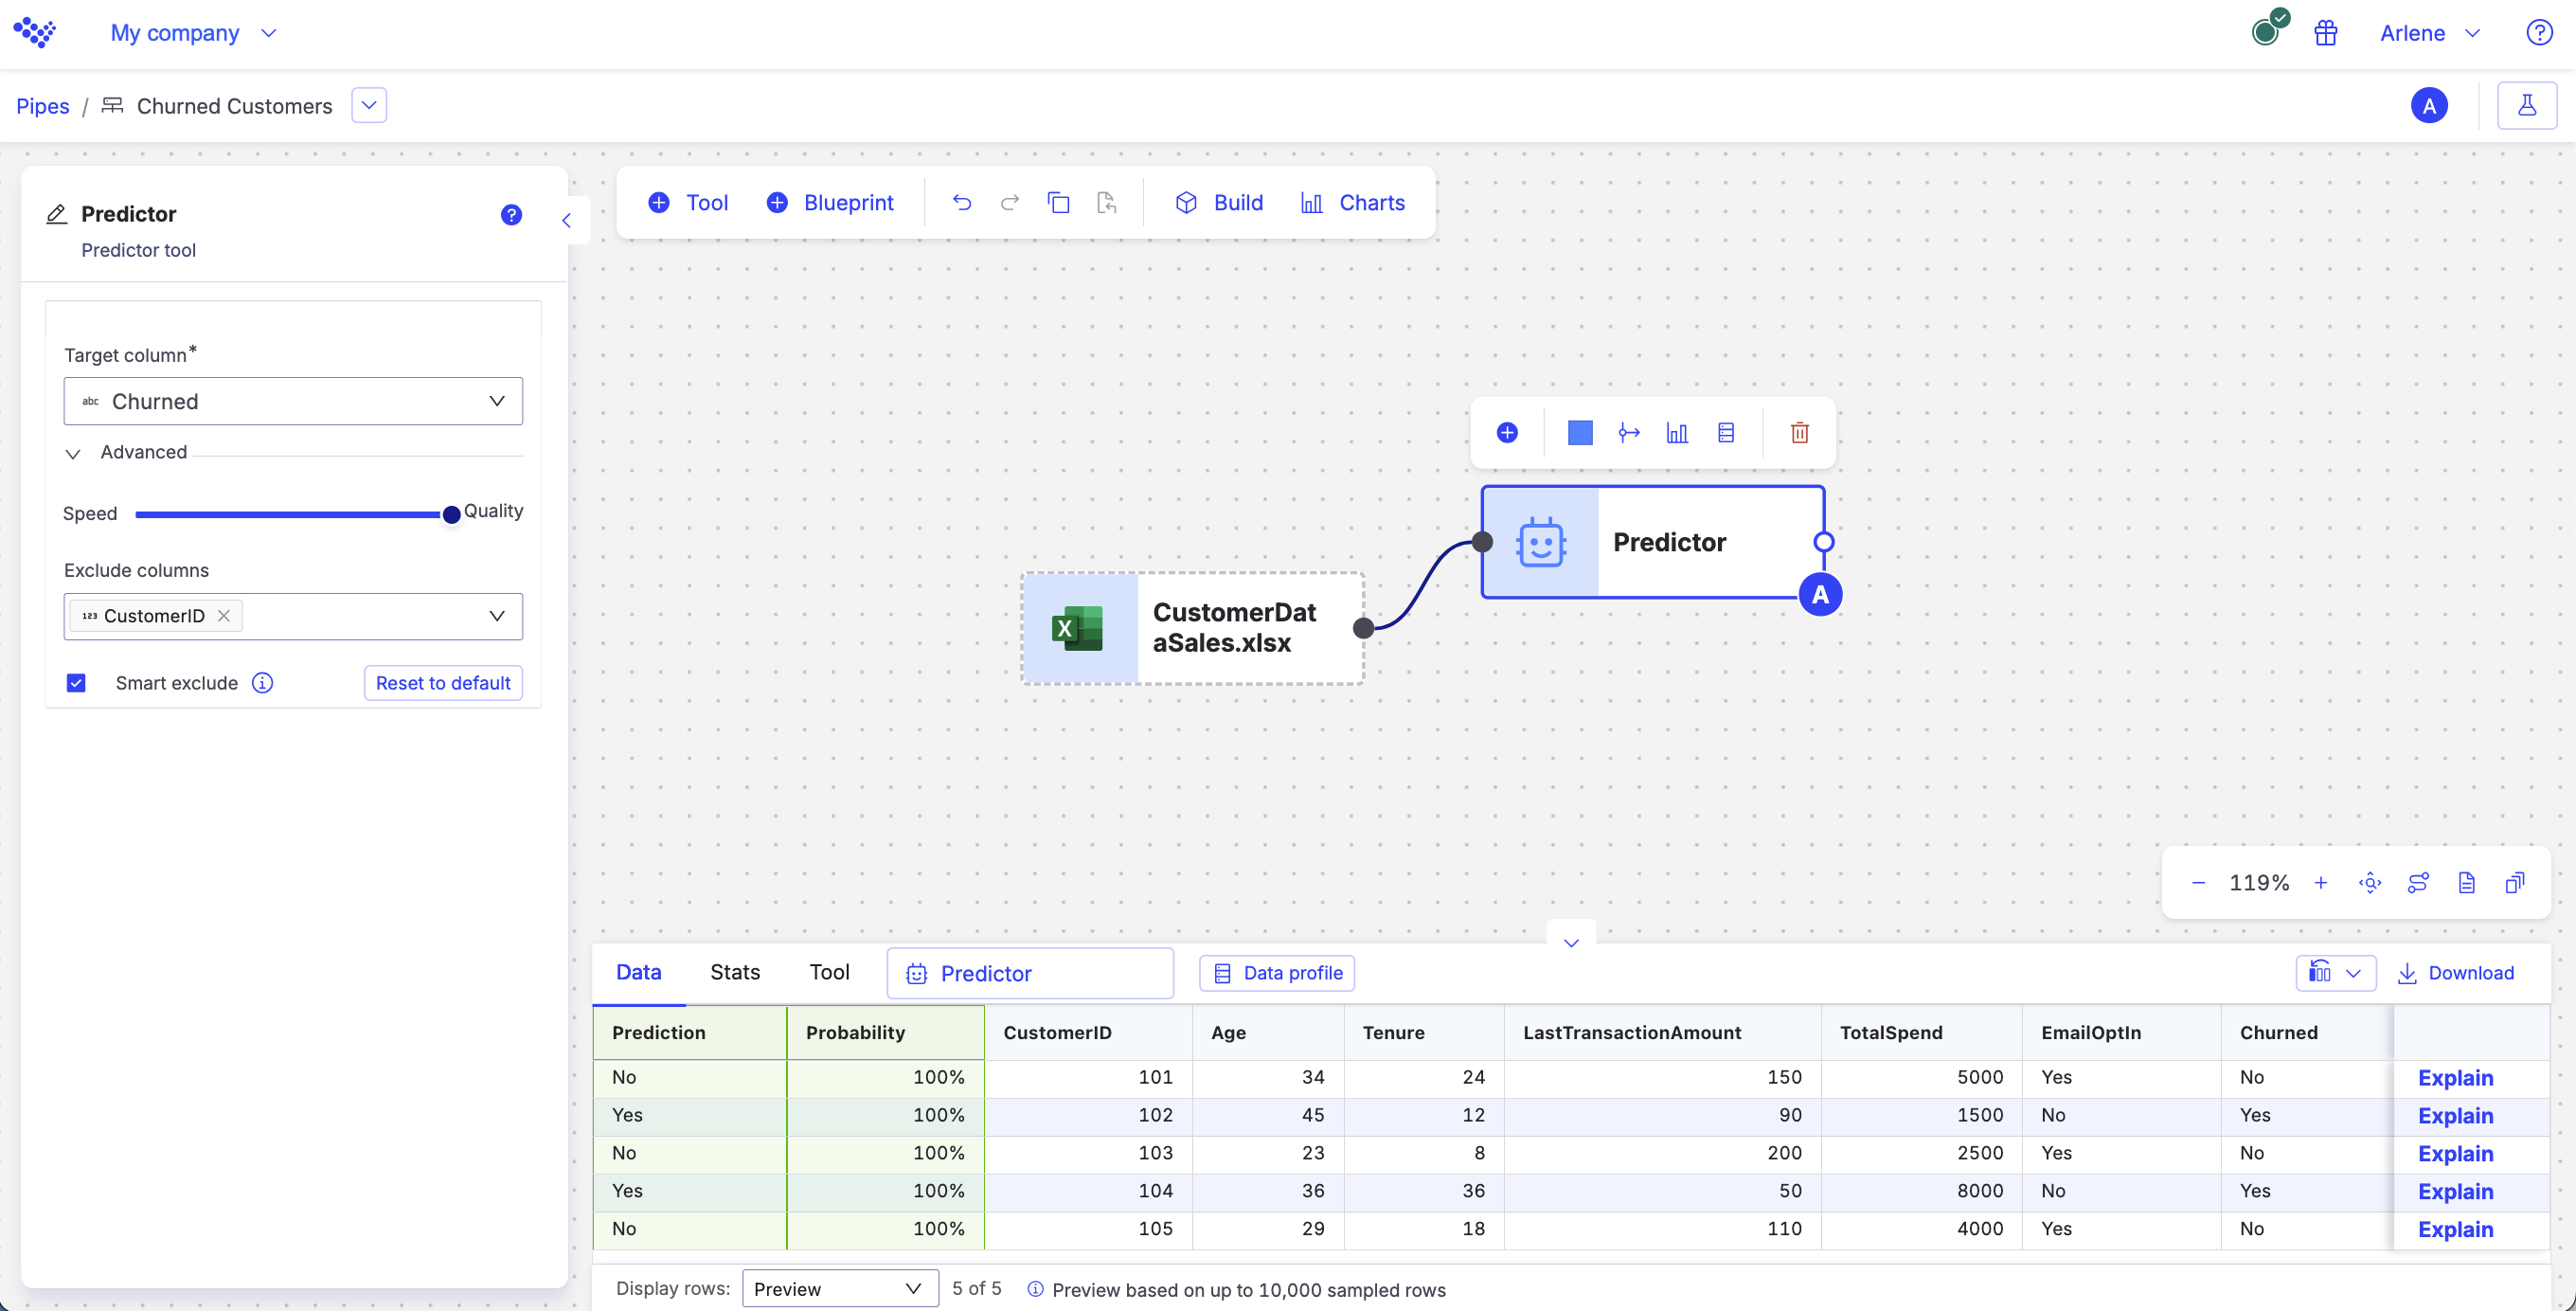
The original dataset is augmented with predicted Churned values and associated probabilities, helping the company forecast customer behaviour trends. This gives you the opportunity to take preemptive actions such as a targeted retention campaign for customers predicted to churn.