Troubleshooting Sankey diagrams
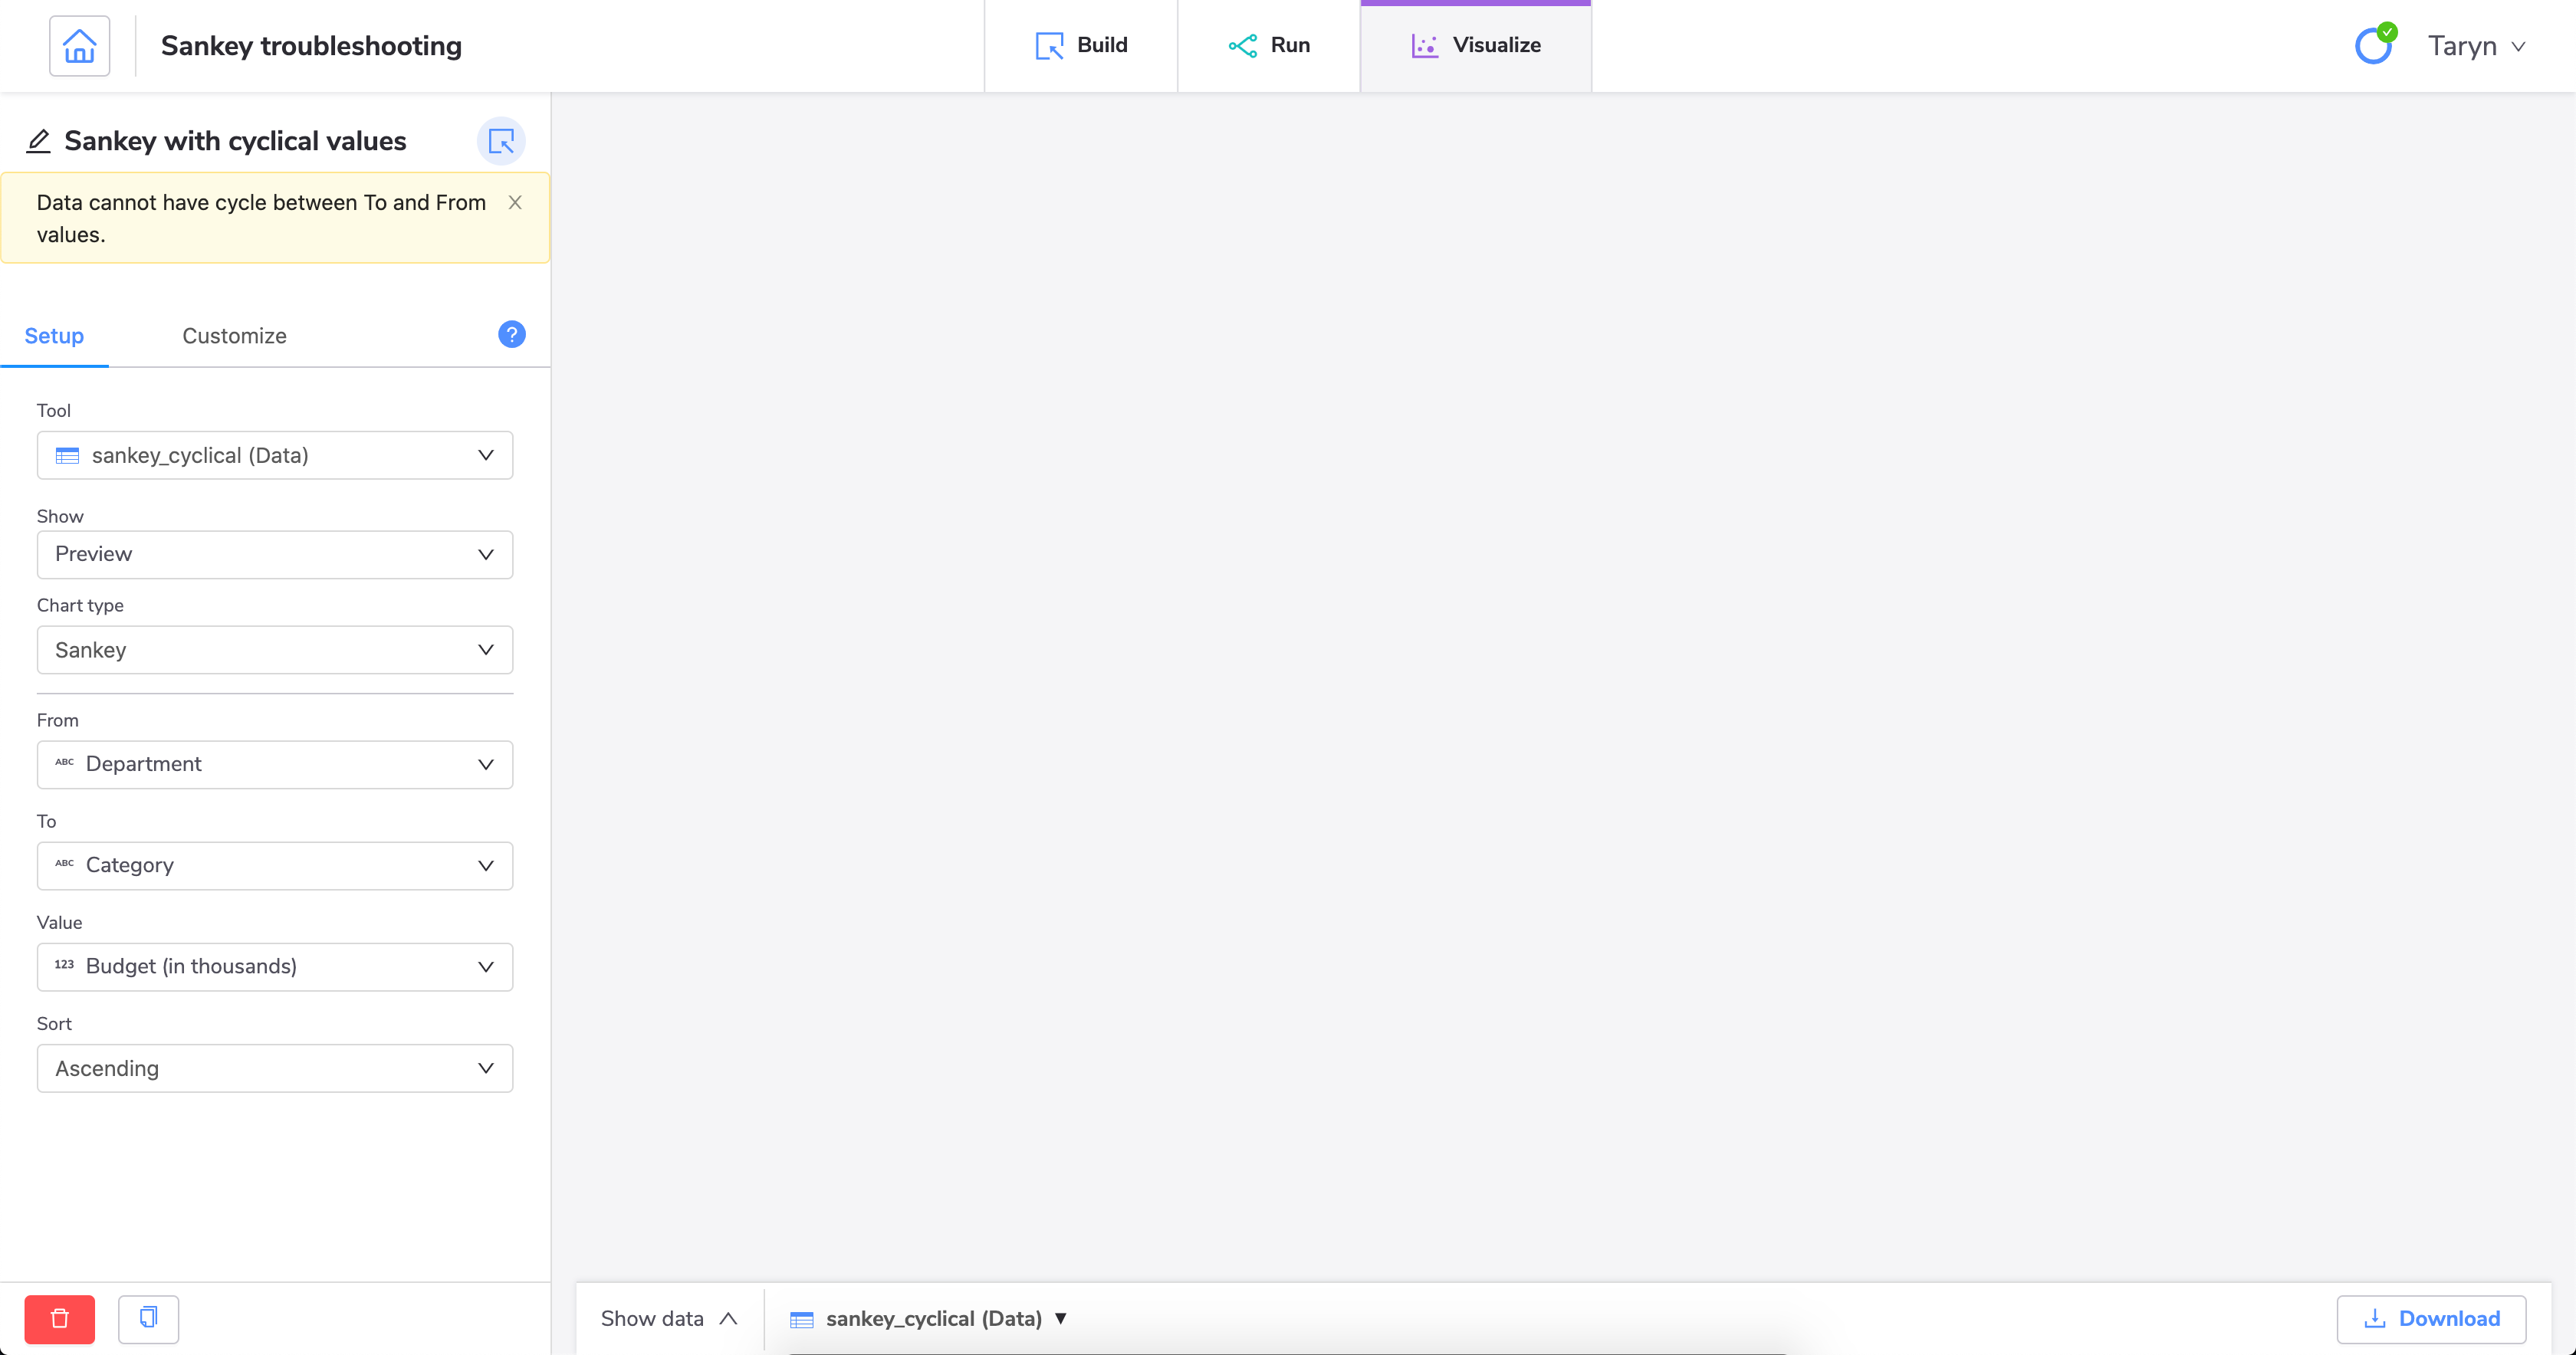
If you're having trouble creating a Sankey diagram, it could be because you have cyclical values in your data set.
The easiest way to create a Sankey diagram without errors is to ensure you have distinct values for each category. The categories you define are used in the From and To fields when you configure the visualization.
Let's look at this example data set:
Department | Budget (in thousands) | Type |
|---|---|---|
Sales | 80 | HR |
Sales | 40 | IT |
Sales | 20 | Misc. |
Development | 120 | HR |
Development | 67 | IT |
Development | 30 | Misc. |
Support | 75 | HR |
Support | 45 | IT |
Support | 12 | Misc. |
HR | 72 | HR |
HR | 20 | IT |
HR | 10 | Misc. |
In this sample data set, we do not currently have distinct categories. We are using HR as a category in both the Department column and the Type column. If we try to create a Sankey diagram with these values, we'll get an error.

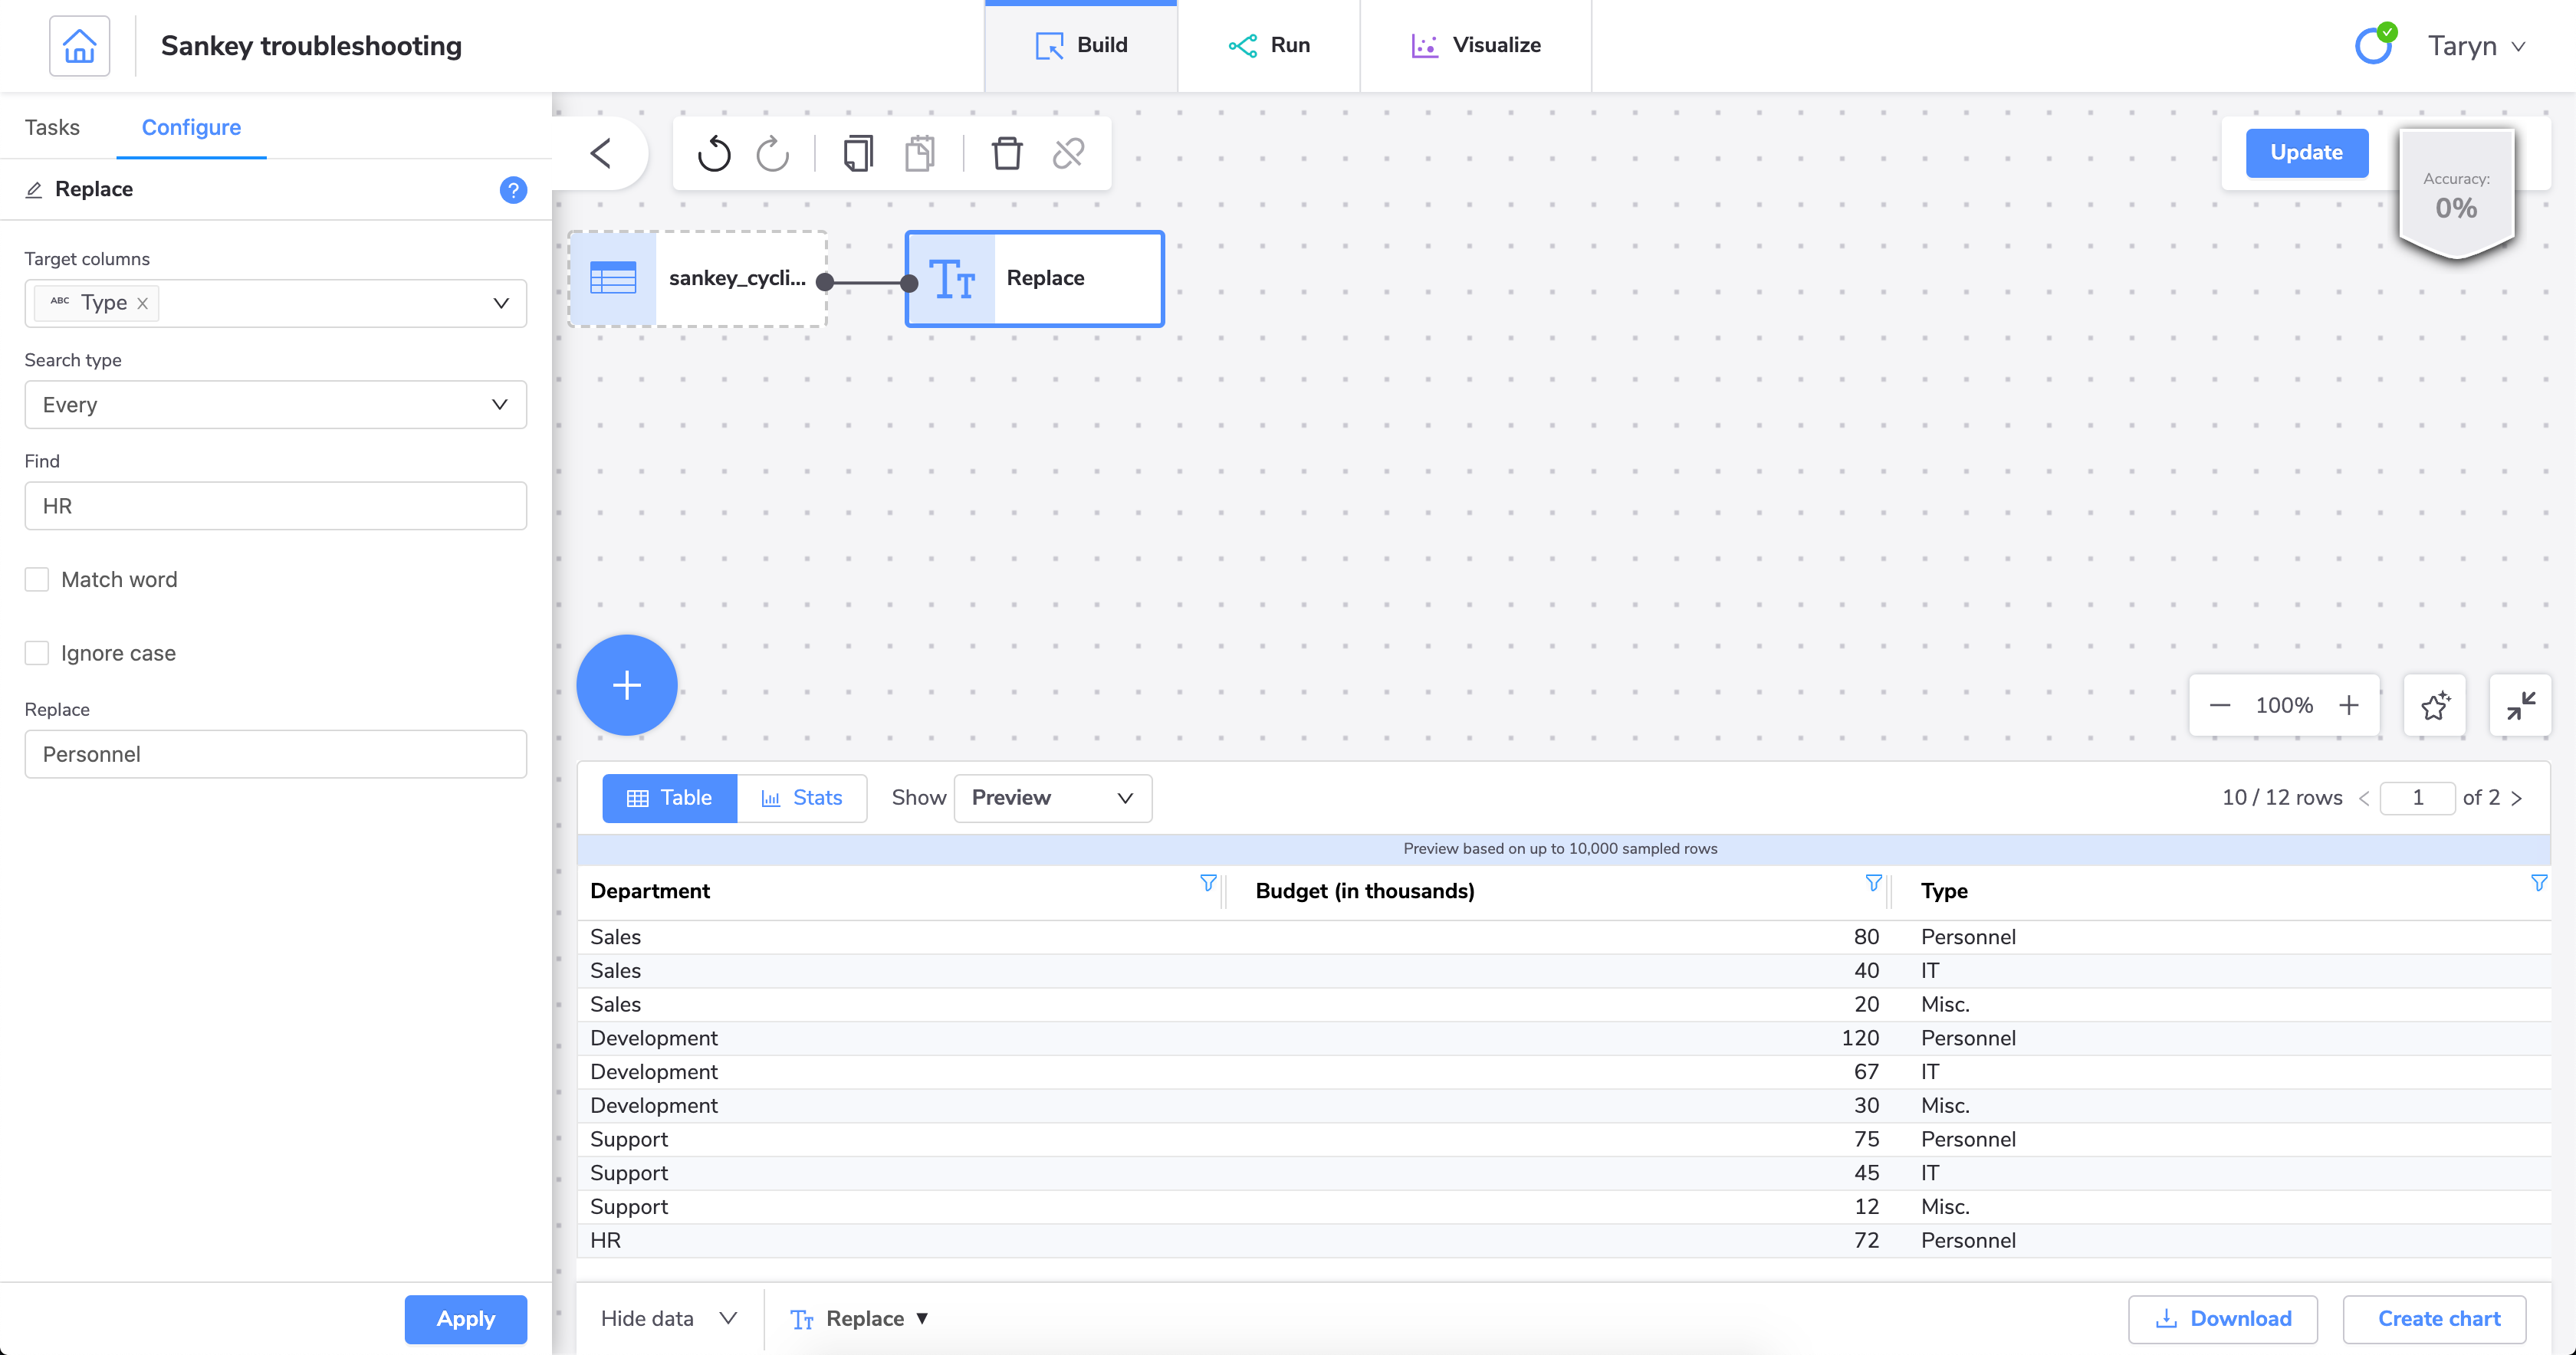
We can fix this by using the tool to change the HR value to a different value in one of the columns.

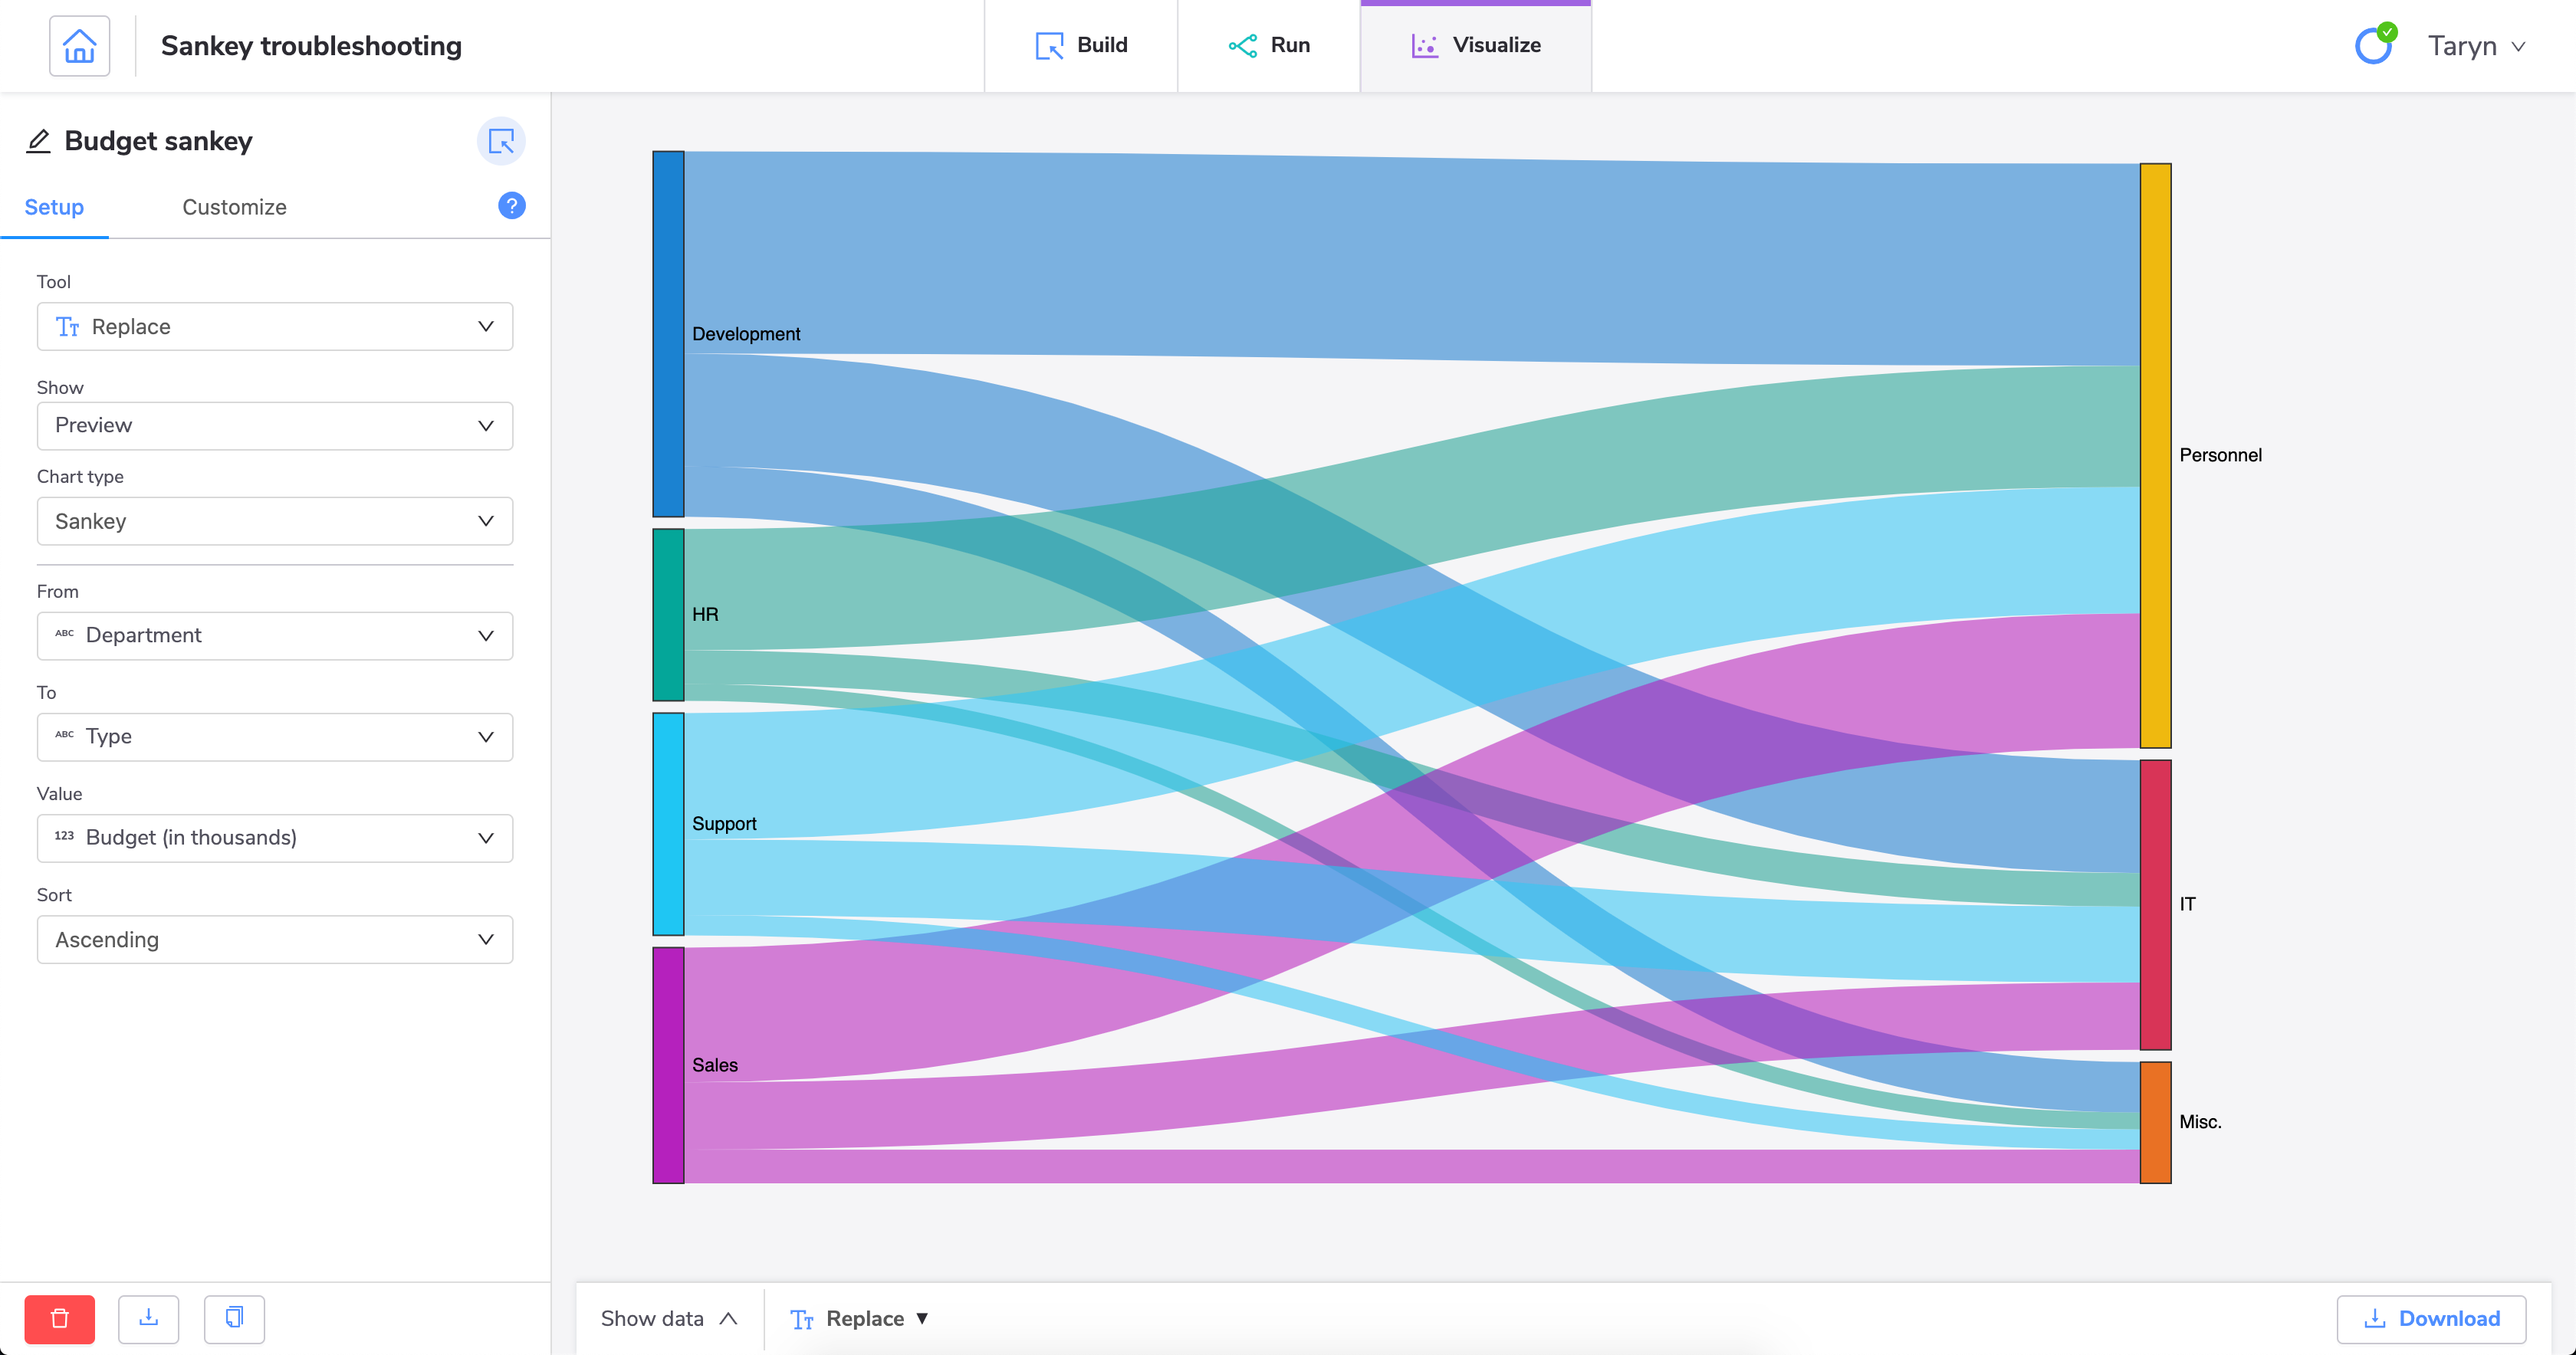
With this change, we can now successfully create a Sankey diagram.
