Lookup
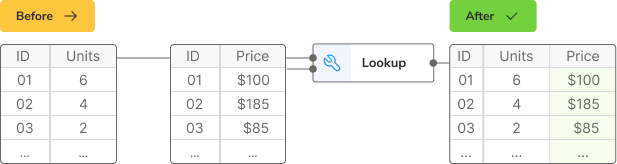
Use the Lookup tool to look up matching values in multiple selected columns in two data sets. When the Lookup tool finds a match, the tool adds the values as new column(s) that appear in the output. The tool takes the lower value when there are multiple matches.
Input and output
To use this tool, you will need two sets of data, a main data set and a lookup data set. There are three fields to configure for the input:
The first field is the Top match column, which is the main data set.
The second field is the Bottom match column, which is the lookup data set.
The third field is the Column(s) to add to top, which is where you can select one or more columns from the bottom data set.
Configuration
Use the following configuration options to configure the Lookup tool.
Go to the Pipes module from the side navigation bar.
From the Pipes tab, click an existing pipe to open, or create a new pipe. To create a new pipe, read the Creating a pipe documentation.
In the Pipe builder, add a data source to your pipe. For more information on adding a data source, see the Data Input tool.
Click
 + Tool.
The Tools modal opens, where you can add tools, such as the Aggregate tool, to your pipe.
In the Tools modal, search for Lookup and then click + Add tool.
Tip
You can also find the Lookup tool in the Combine section.
Click the tool node and drag the line to the next tool to connect the tools. If you need to undo the action, click the line and then click Unlink.
In the configuration section, under Top match column, select the column to use as the top match column.
Under Bottom match column, select the column to use as the bottom match column.
Under Column(s) to add to top, select the columns to add to the configuration.
Click on the tool name to rename your tool node to a meaningful name. Name your tools in a way that describes the function, not the object or the data action. For example, use “Look up rate” instead of “Join to rate table”.
Usage example
You want to match the Region code in the top and bottom data sets, and add the corresponding Chair of board and Number of schools columns. Here is an example of the top and bottom data sets and the output:
Region | Region code | Number of students | Number of teachers |
|---|---|---|---|
School board A | 000 | 999,999 | 150 |
School board B | 111 | 111,111 | 50 |
School board C | 2222 | 222,222 | 75 |
Region code | Chair of Board | Number of schools |
|---|---|---|
000 | Audrey Peters | 150 |
111 | Luz Reyes | 100 |
2222 | Simon Green | 50 |
000 | Audrey Peters | 100 |
Here is the output from the Lookup tool:
Region | Region code | Number of students | Number of teachers | Chair of Board | Number of schools |
|---|---|---|---|---|---|
School board A | 000 | 999,999 | 150 | Audrey Peters | 100 |
School board B | 111 | 111,111 | 50 | Luz Reyes | 100 |
School board C | 2222 | 222,222 | 75 | Simon Green | 50 |