Scores
Compare the model score to the baseline score to understand the work you're doing in the pipe is improving your model accuracy. It's easy to think about scores in Varicent ELT as if they're absolutes. But it's more complex than that. When you run a predict tool, you're trying out different things to get a better score.
Scores in Varicent ELT are always relative to the following:
The data set
The baseline score
Each iteration of data preparation and testing
Always compare the model score, which is the pipe you build and configure, to the baseline score. This will help you understand whether the work you're doing in the pipe is improving your model accuracy. There isn't a universal "good score." If the model score is lower than the baseline score, this could mean that there isn't enough relevant data to accurately predict those values.
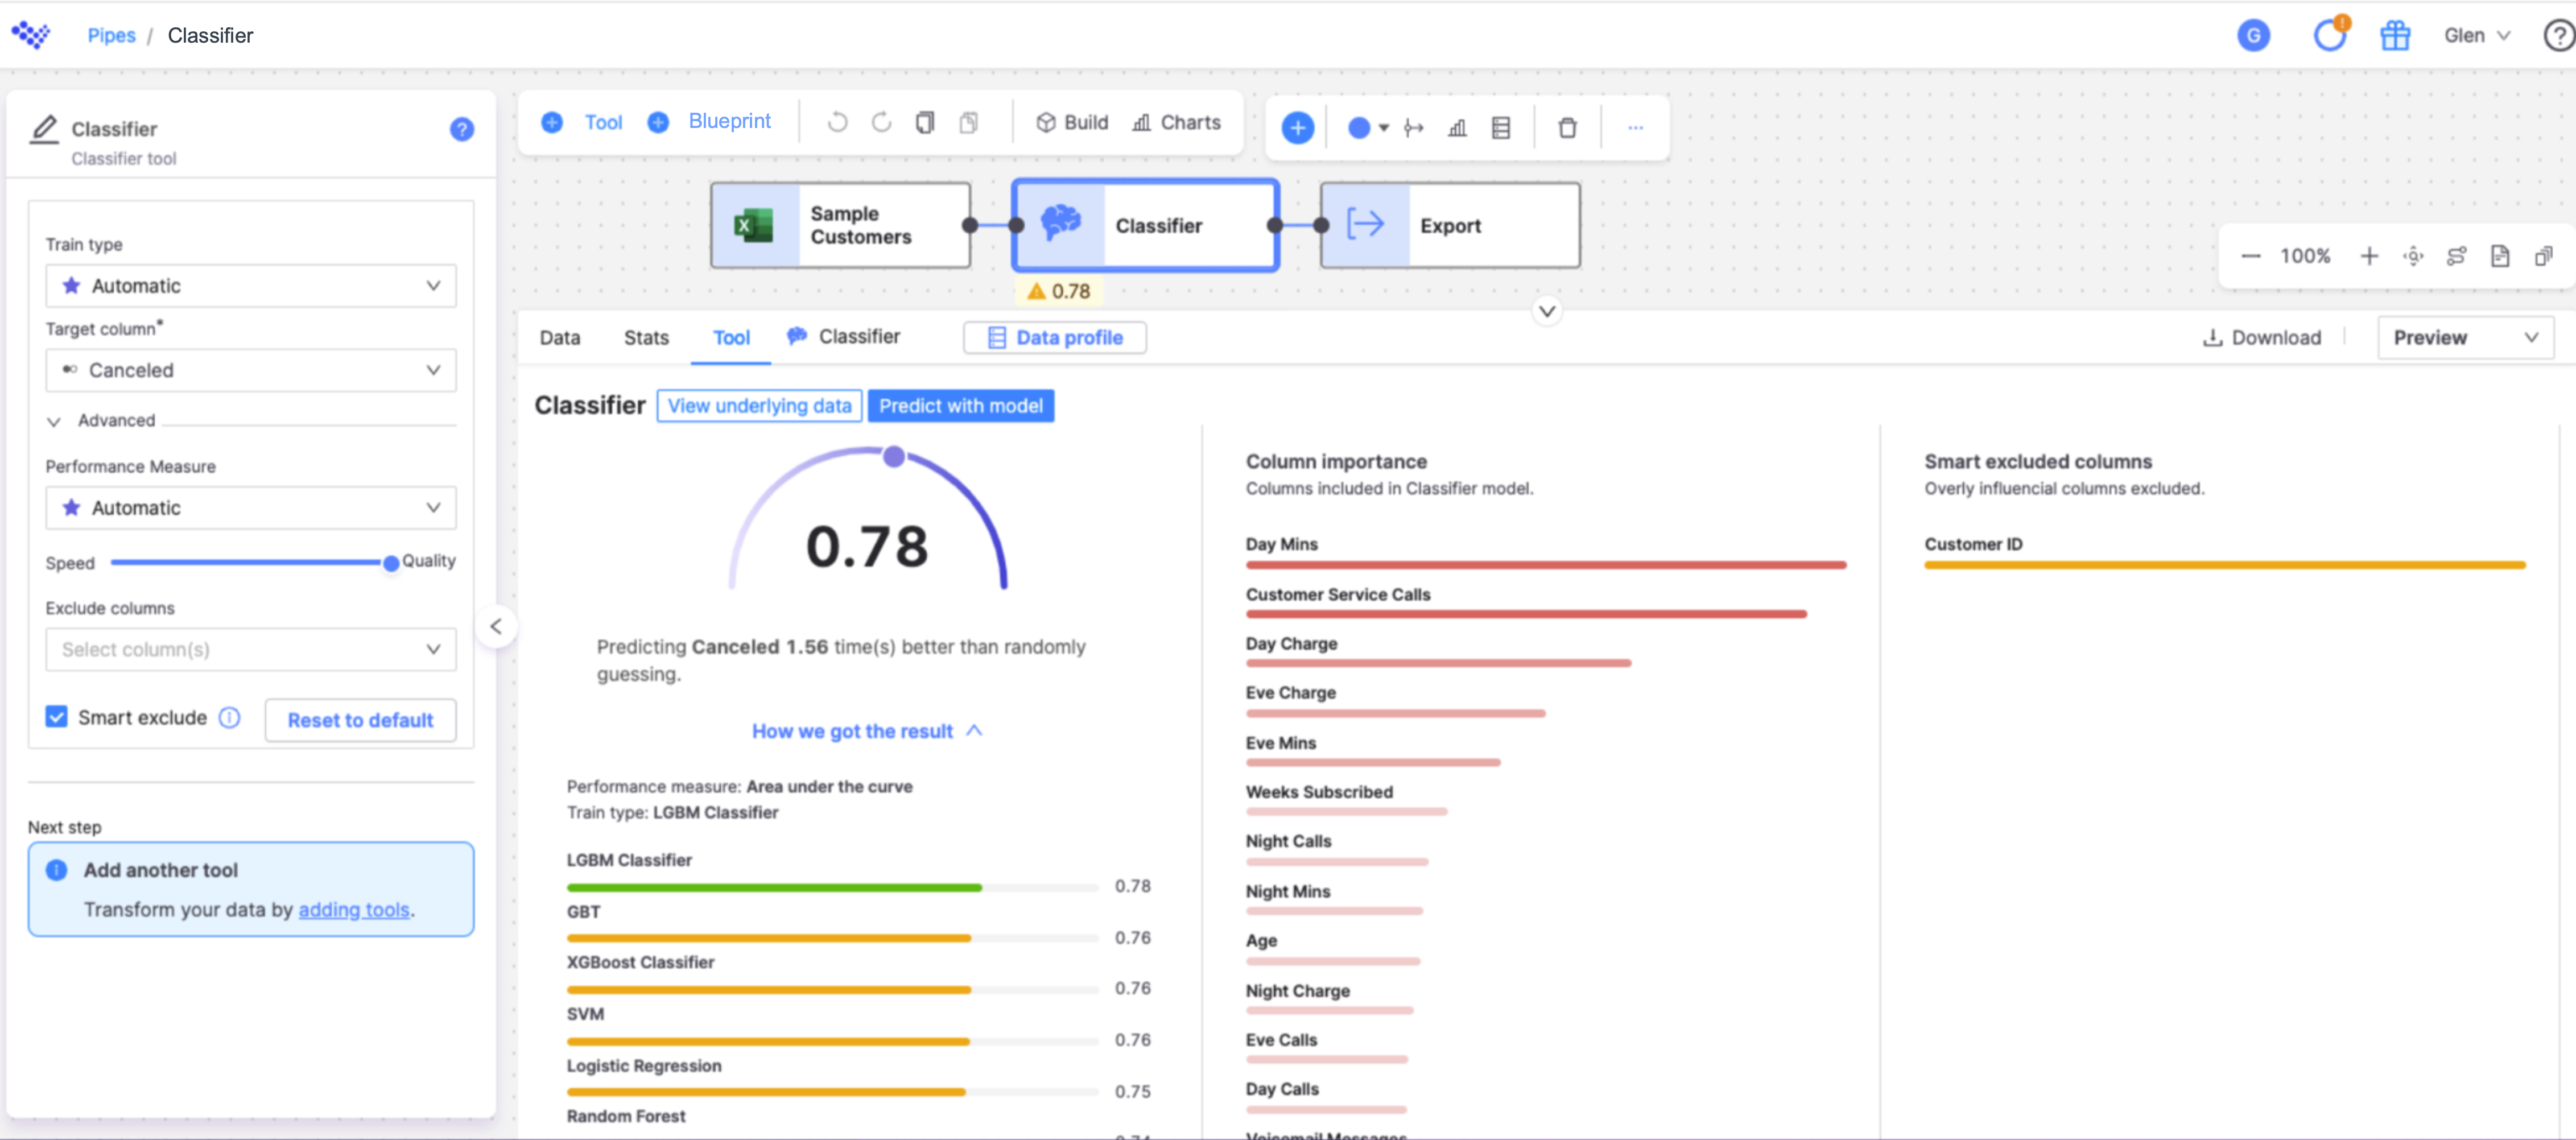
If you click on the Tool tab in the Row viewer, you can see a more detailed view of your model's score. The baseline score can help you understand why you're getting a particular score.
Users can go to the Underlying data page to get deeper insights about the models accuracy:
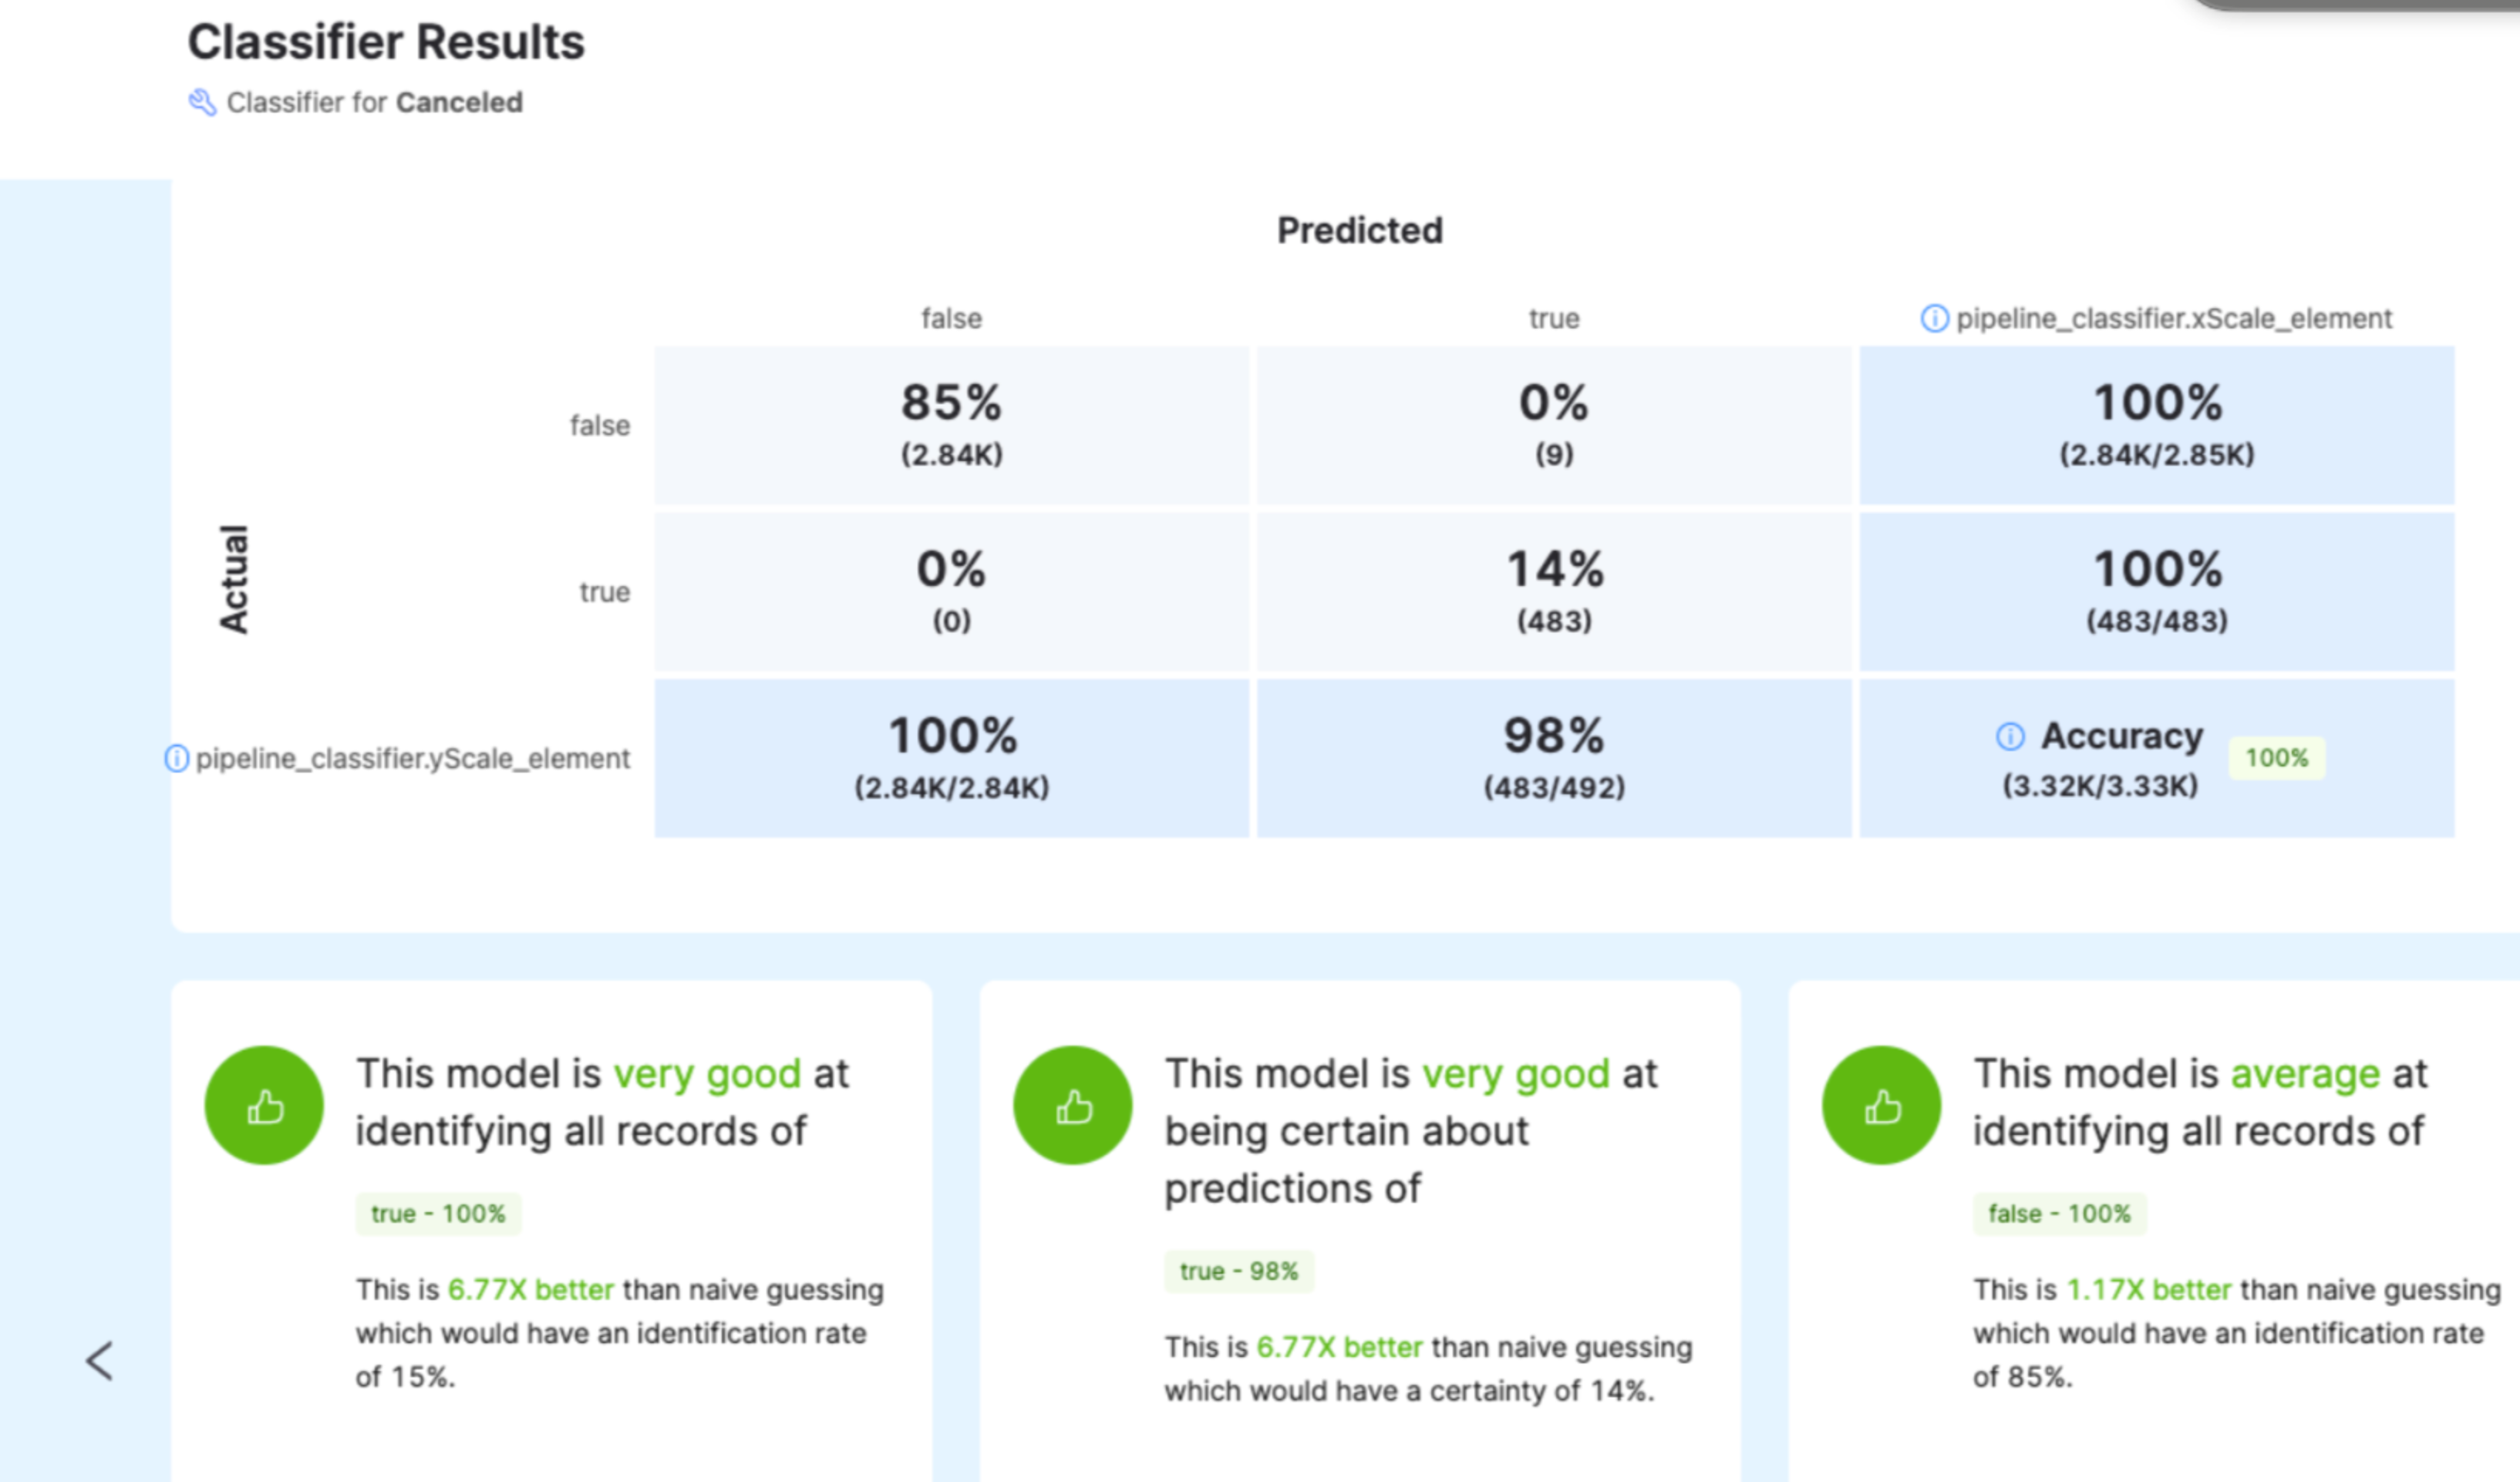
A good way to compare values in your data against predicted values is to use the Confusion Matrix tool.
Classifier scores
Classifiers train the model to predict a column with a fixed set of values. Classifiers get an accuracy score ranging from 0-100 percent. The closer the score is to 100 percent, the more accurate the classifier is.
Remember that the score is always relative to your data set and the problem you're trying to solve. A score close to 100% could mean there's a column in the data set that predicts the outcome you're looking for. Or it could mean there's a strong correlation. For another data set, a score of 60% could be a good score.
Regressor scores
Regressors train the model to predict a column with many possible values. Regressors get a SMAPE (symmetric mean absolute percentage error) score. For simplicity, you can think of this as your model's measure of error. The SMAPE score ranges from 0-200 percent. The closer the score is to 0 percent, the lower the potential for errors.
Just like with classifiers, a regressor score is relative to your data set and the problem you're trying to solve. A score of 100 could still be a good score for your data set.