Dashboards
Use the Varicent ELT dashboard feature to help you organize your charts. There are two types of dashboards: pipe dashboards and the dashboard tab.
Pipe dashboards
Members with the administrator role can create, edit and delete charts within their pipes.
From the side navigation bar, select the Pipes module.
In the Pipes module, select the pipe that you want to create a dashboard for.
In the toolbar, click Charts to either create a new chart or select an existing chart.
Click All charts.
You are redirected to the Dashboards page.
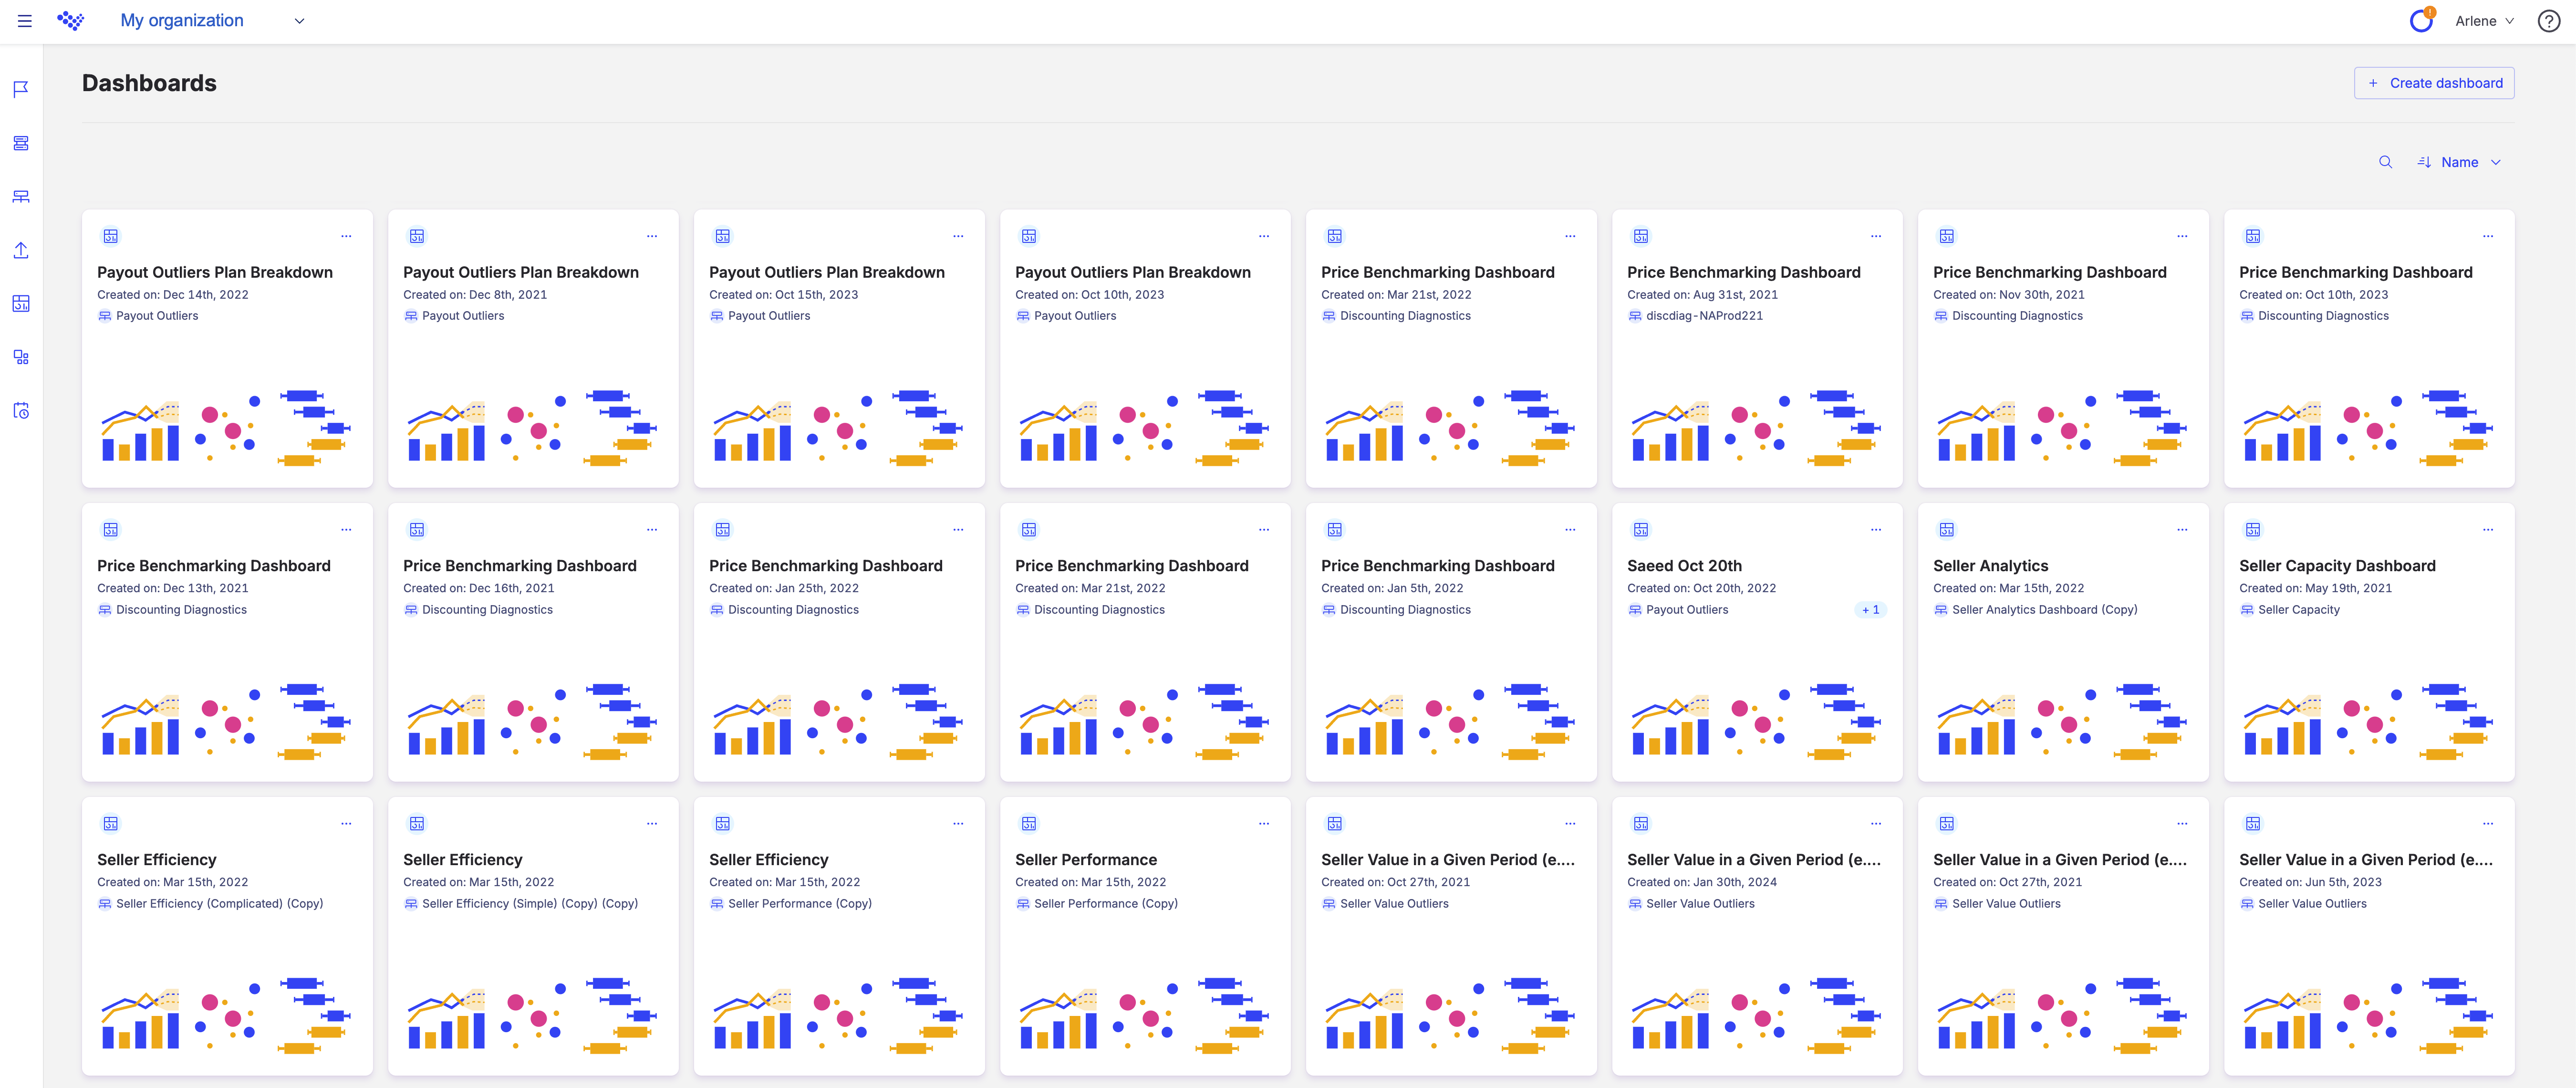
If you don't have any dashboards, click Create dashboard.
Click Edit a dashboard.
On the Edit a dashboard modal, select the charts to appear on the dashboard.
Click Edit.
You are redirected to your newly created dashboard.
If you have a dashboard, click on the dashboard.
Click Untitled to name the dashboard.
Click
 to add a chart or filter to the dashboard.
The dashboard is now ready.
Tip
You can also add notes to individual charts. From your dashboard, click on the ellipses next to the chart you'd like to add notes to, then click View chart. A side panel will appear beside the selected chart for your notes.
With your dashboard set up, you can change the layout of your charts by resizing them.
Go to the selected chart.
Click the bottom right-hand corner of the tile and drag the corner of the tile to resize the tile into the desired size.
With your dashboard set up, you can change the layout of your charts by rearranging them.
Click the title of the selected chart.
Drag the chart to your desired location.
Dashboards tab
The dashboard tab displays any dashboards that are created on both the pipe and Dashboard tab. Administrators can create dashboards using charts from multiple pipes from the Dashboards tab.
Administrators can create, edit, filter, share and delete dashboards to both administrator users and Dashboard viewers. Administrators can edit a chart’s pipe from the cross-pipe or in-pipe dashboard and the chart will be updated in all the places it exists.
Dashboard viewers can review and interact with the dashboards. For more information about dashboard viewers, see Users.