Charts
Use the Varicent ELT charts feature to help you create and explore your data in a visual form.
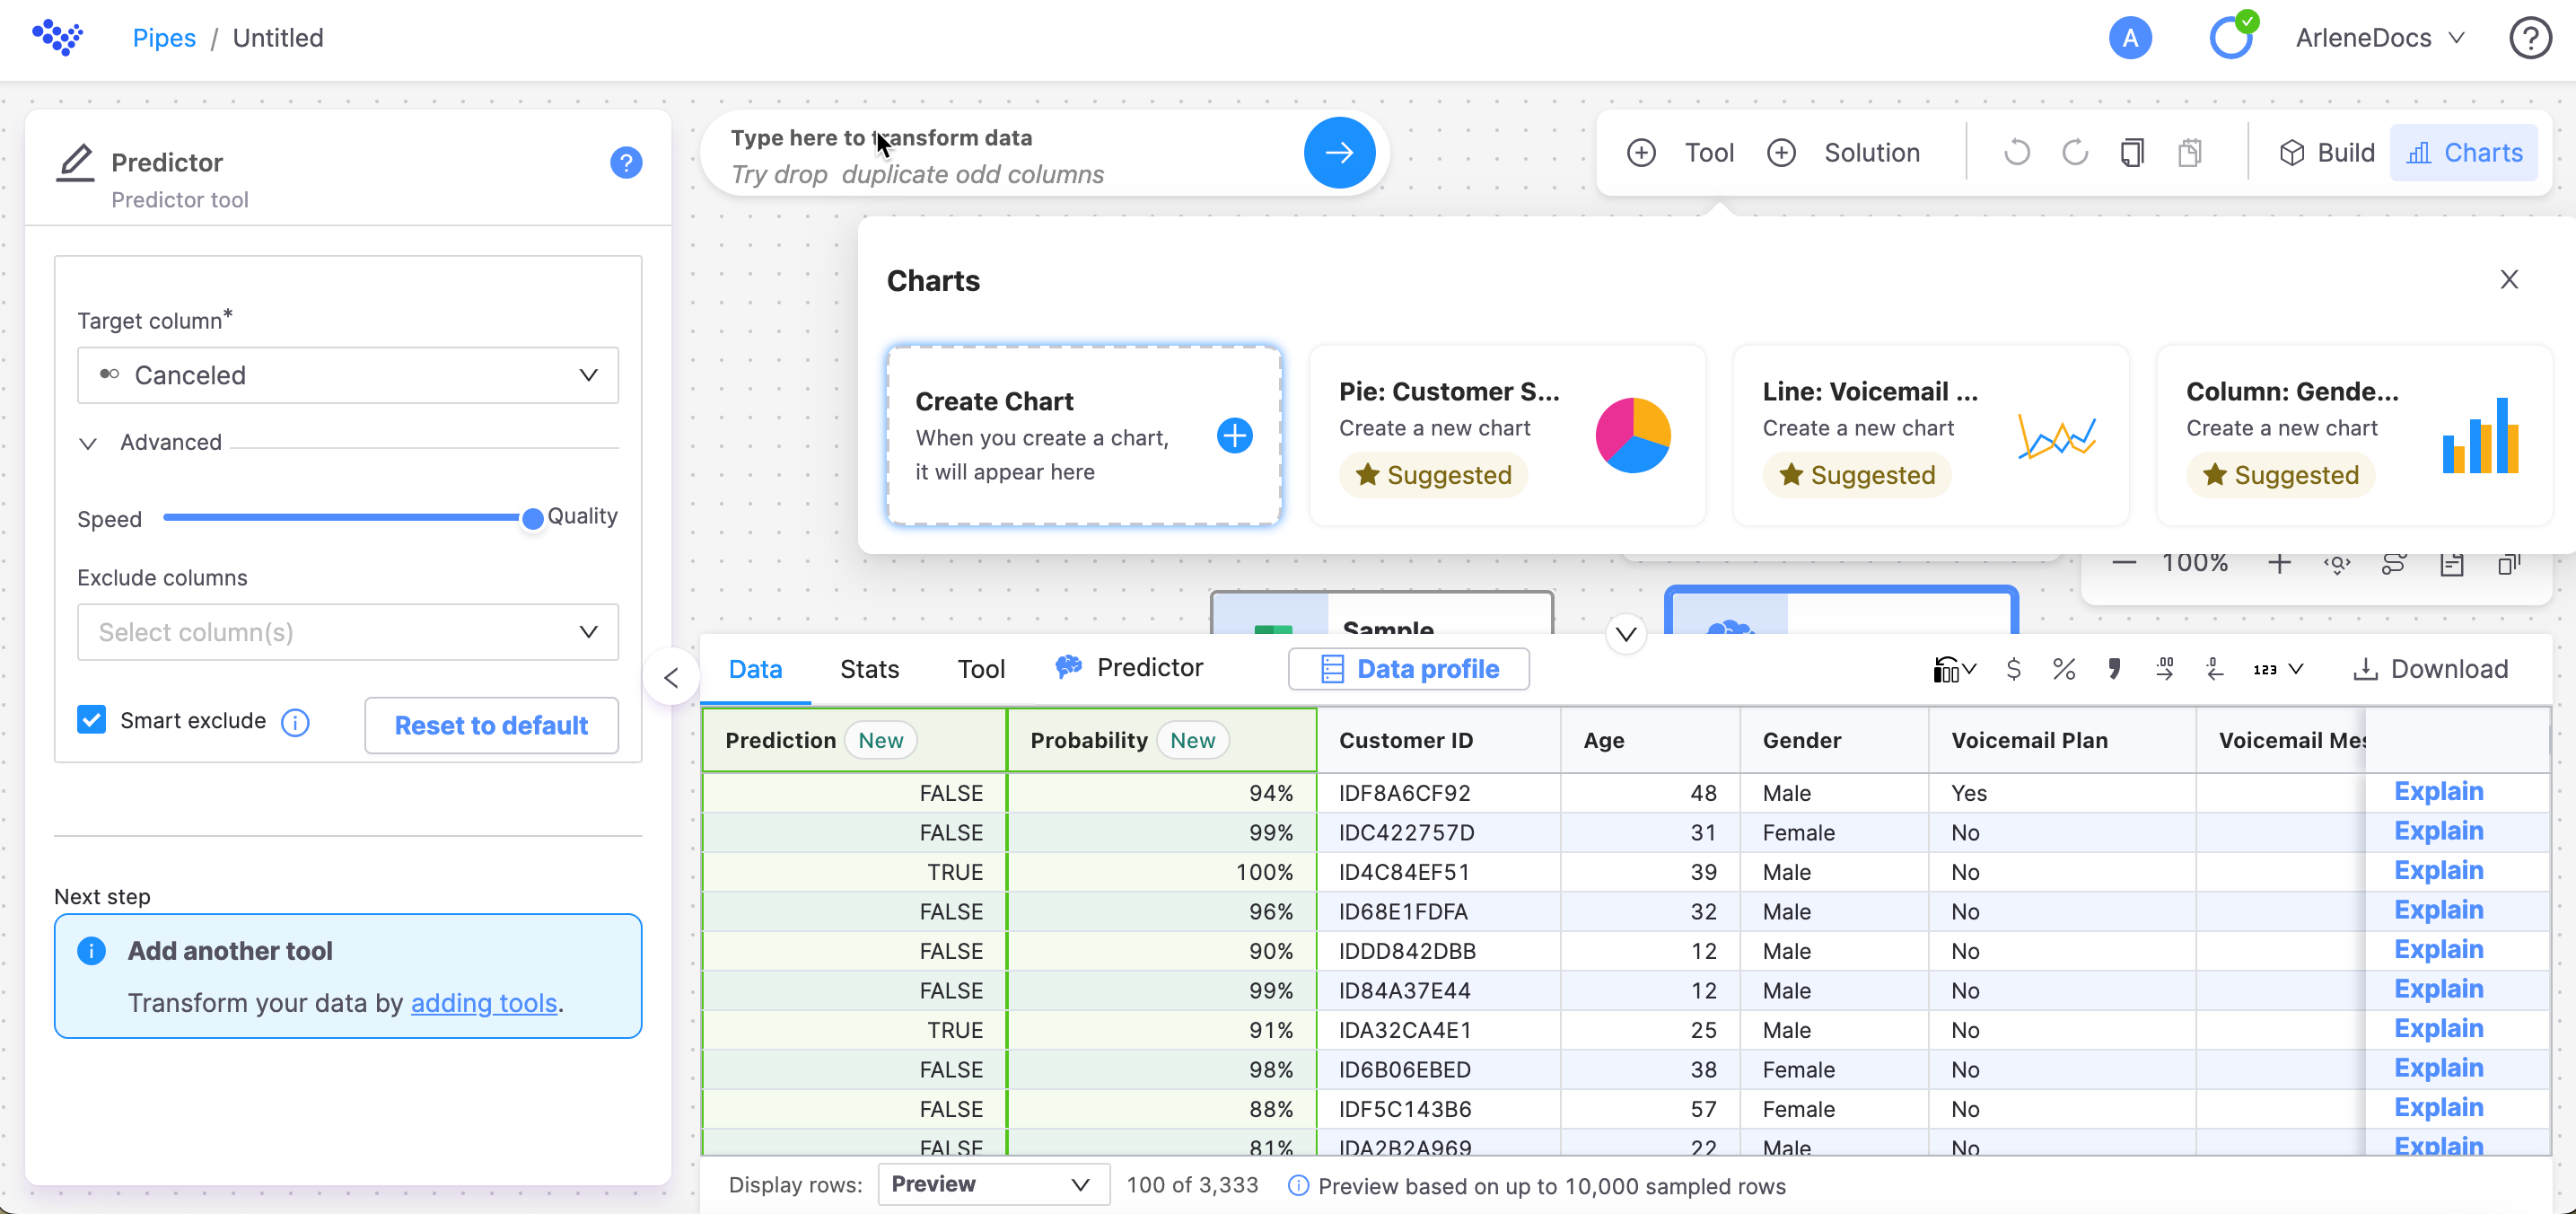
From the side navigation bar, select the Pipes module, and then click on an existing pipe or create a new one.
Note
For more information about how to create a new pipe, see Creating a pipe.
On the toolbar, click the Charts button.
Click Create Chart, or select a chart from one of the chart suggestions.
Note
If you currently have a chart for that pipe, you can still create a chart, table or dashboard. Click +Create Chart.
Configure the chart.
Click Untitled to name the chart.
On the Setup tab, configure the following fields:
Note
Depending on the chart type, there will be more fields to configure. These fields are extra to the ones mentioned in the following table.
Table 3. Setup tab configurationField
Description
Tool
Select the tool that you want to use for the chart.
Show
Select the data that you want to see, such as preview or last built.
Chart type
Select the type of chart that you want to use. Choose from line, area, column, bar, pie, scatter, map, table, histogram, combo, candlestick, radar, waterfall, forecast, sankey, heatmap, and boxplot charts.
On the Customize tab, configure the following settings:
Table 4. Customize tab configurationField
Description
Chart and axis titles
Select the options that you want to include, Include chart title, Include chart subtitle, and Include horizontal axis title.
Horizontal axis label angle
Select the angle from 0 to 90 degrees.
Include vertical axis title
Select if you want to include a vertical axis title. If yes, give the axis a title.
Vertical axis label angle
Select the angle from 0 to 90 degrees.
Left margin, Right margin, Top margin, Bottom margin
Select the margin spacing for the left, right, top and bottom margins.
Colour
Select the colours for your chart. Use the color picker or input a hex or RGBA number.
Legend
Select Include legend to add a legend.
Position
Select the position for the legend. Choose from bottom left, bottom center, bottom right, middle left, middle right, top left, top center or top right.
The chart is ready to explore.