Classifier
Important
The Classifier tool is only available to users with the Varicent Advanced Algorithm Library subscription add-on. If you are interested in using this tool, please contact your Varicent Customer Success Manager.
Use the Classifier tool to train the model to predict a column with a set of values.
This tool checks multiple classification algorithms or models and chooses the best one when model_type is set to automatic.
Note
The speed and quality slider is more of a spectrum. This setting determines the number of machine learning models considered. Models that do not support the training data are automatically excluded.
This tool adds two columns to your data: a prediction and a probability. It's the model's certainty about the prediction.
When you run the tool, the data is automatically split: 80% of the data is used for training. The remaining 20% is used for testing. Each model being considered is trained and evaluated to select the one with the best score. This is done 5 times to predict the test values (the 20% of your data). The final score is the average of all 5 scores.
Tip
You can configure this tool without using the configuration menu.
In the menu, start typing the first few letters of the tool name and press tab to auto-complete. Then start typing the name of the column you want to use and press tab to auto-complete.
Data profile chart visuals
From the Row viewer, you can access the Data profile link to open the column details and compare column visuals.
From the Row viewer, you can access the Data profile link to open the column details and compare column visuals. The results are available when you select one of the Classifier, Predictor or Regressor tools.
In your selected pipe, go to the Row viewer.
Click on the Data profile link in the row viewer.
The Data profile page opens with column details and compare column visuals.
Note
If you have an explainable tool upstream, you can still get an error message with one of the following issues:
The schema has changed in the export. For example, a missing column or an extra column is present.
There are multiple explainable tools in the pipe upstream.
The pipe changed, and the calculation is now invalid.
If there is no Data profile link, no explainable tool is selected in the upstream pipe.
When to use this tool
Use when you want to predict values.
What is Smart exclude?
Following a successful build using the Classifier tool, Smart exclude identifies and automatically excludes columns that don’t help predict the target column. Smart exclude will only consider columns not already manually excluded. If you want to disable this setting to troubleshoot, test, or run a calculation that is taking too long, go to the Advanced settings under the Configure tab.
How to read the data in this tool
In the row viewer, there are three tabs: Data, Stats and Tool.
The Data tab consists of your imported data. View all of the imported data in one spot.
The Stats tab consists of the statistics for your data. View all of the top values for each column.
The Tool tab visualizes additional insight into the tool and the data. The following columns are available:
Accuracy score: Displays the performance measure based on your data set.
Column importance: Displays the columns in order of importance.
Smart excluded: Displays the columns that don't predict the target column.
Underlying data
In the row viewer, on the Tool tab, there is feature called Underlying data. Click to expand and explore information about your model. The data answers the following questions for your model:
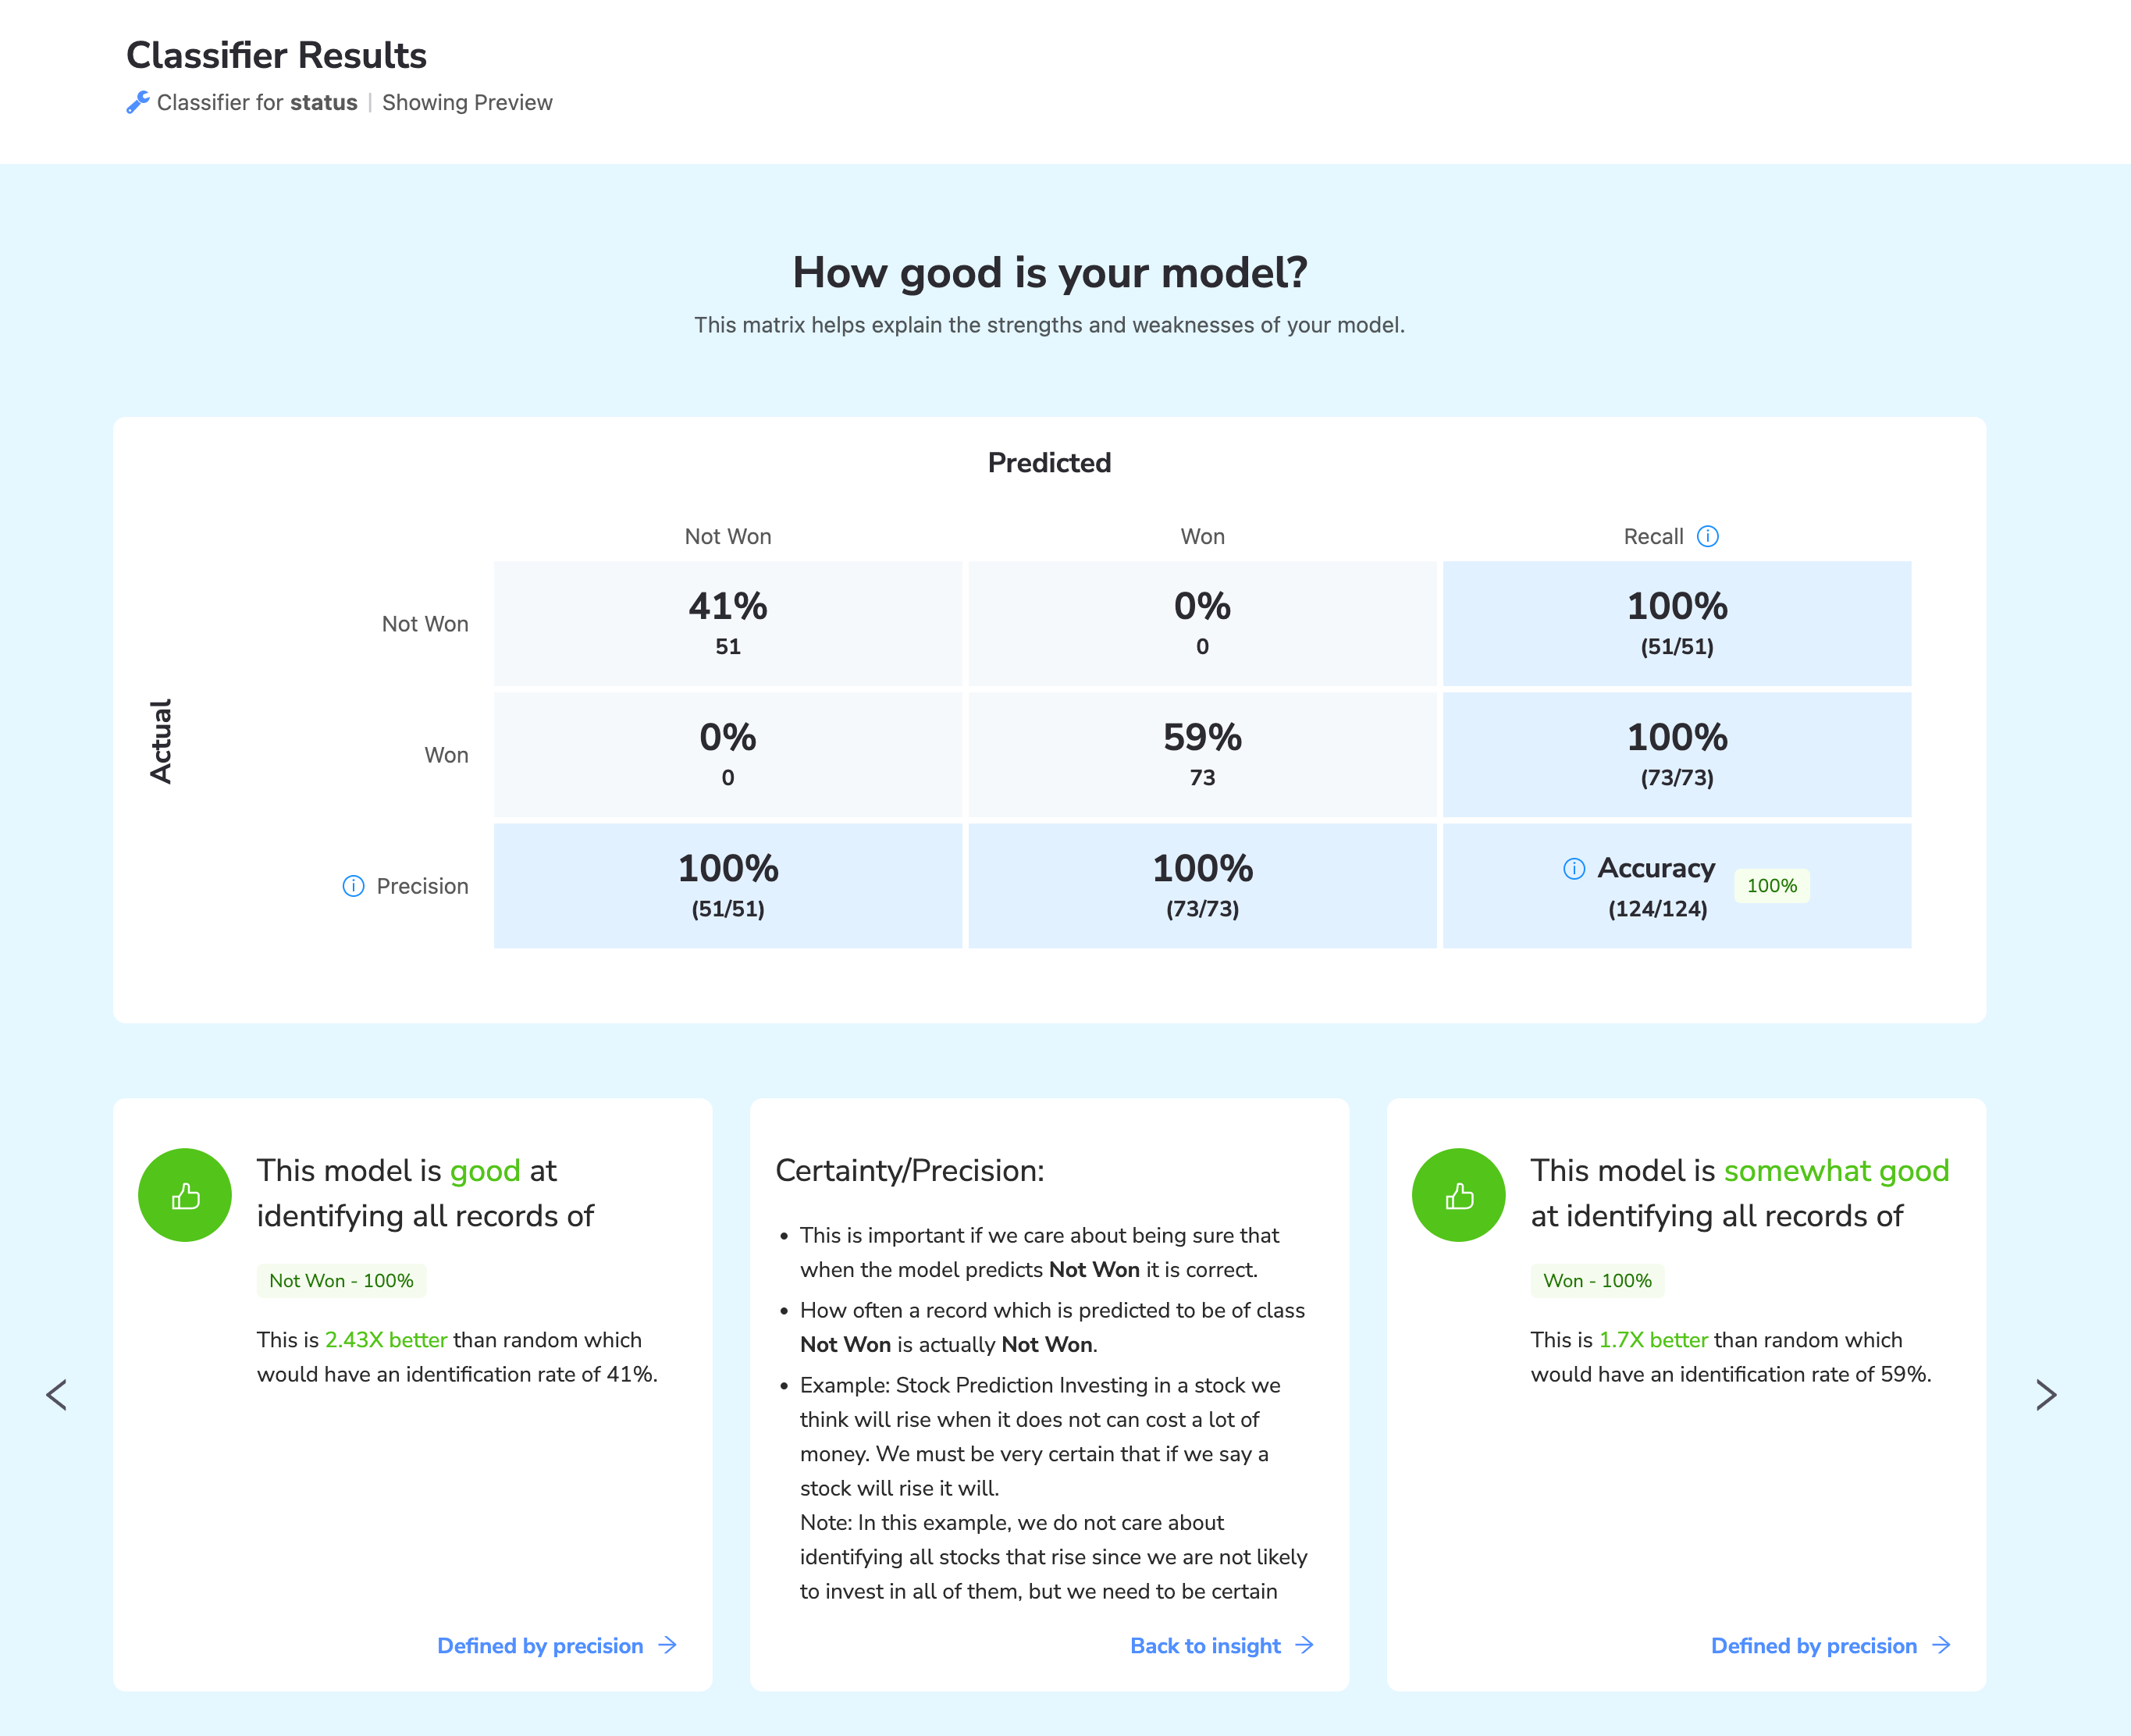
How good is your model? This matrix helps explain the strengths and weaknesses of your model.
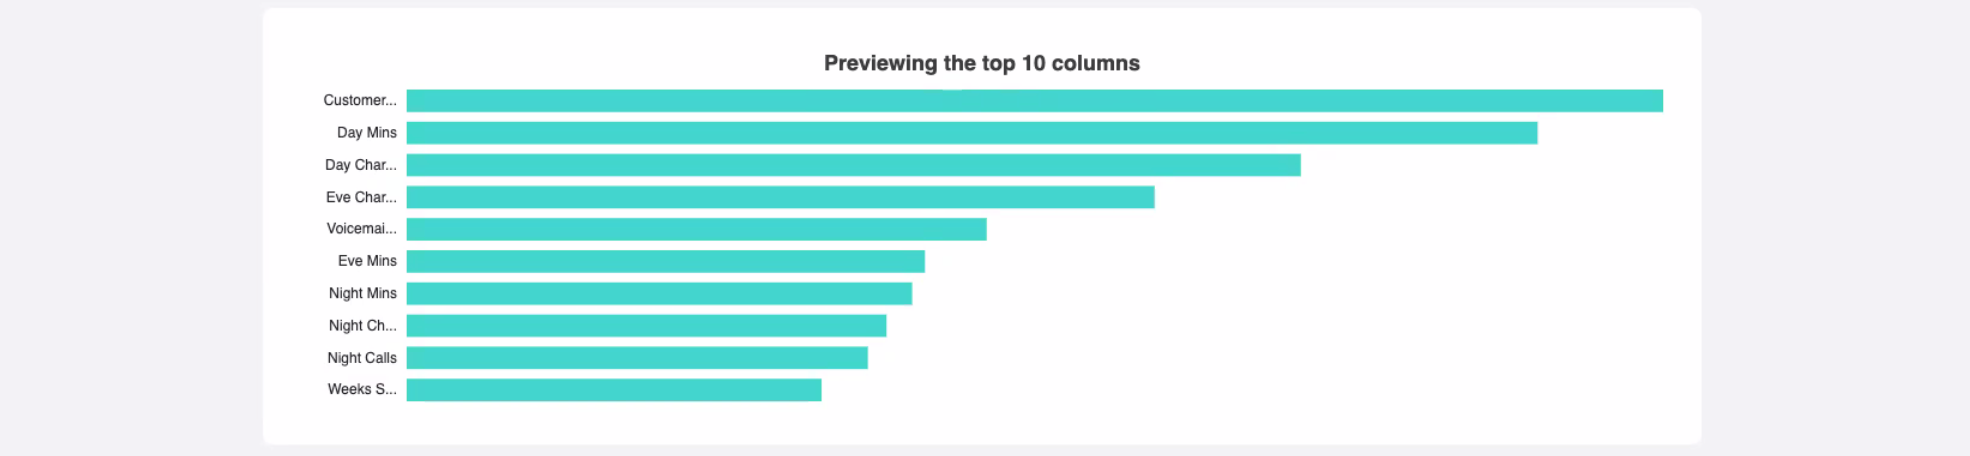
How balanced is your model? This section explains how a well-balanced model is more robust and does not have an overly significant impact from a single column. The visual shows how balanced the top 10 columns are.
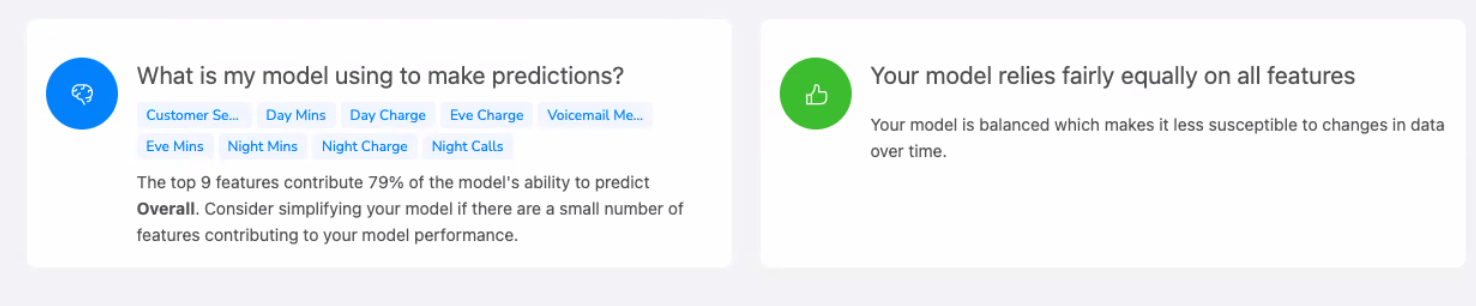
What is my model using to make predictions? This section shows which columns are used to make predictions and the reasons why.
Configuration
Use the following configuration options to configure the Classifier tool.
Go to the Pipes module from the side navigation bar.
From the Pipes tab, click an existing pipe to open, or create a new pipe. To create a new pipe, read the Creating a pipe documentation.
In the Pipe builder, add a data source to your pipe. For more information on adding a data source, see the Data Input tool.
Click
 + Tool.
The Tools modal opens, where you can add tools, such as the Aggregate tool, to your pipe.
In the Tools modal, search for Classifier in the search bar, and then click + Add tool.
Tip
You can also find the Classifier tool in the Learn section.
Click the tool node and drag the line to the next tool to connect the tools. If you need to undo the action, click the line and then click Unlink.
In the configuration pane, under Train type, select the train type that you want to use to train your data.
Automatic
Cat Boost Classifier
Decision Tree
GBT
k-NN Classifier
LGBM Classifier
Logistic Regression
Naive Bayes
Random Forest
SVM
XGBoost Classifier
Under Target column, select the target column to train your data against.
Expand the Advanced section and under Performance Measure, select the type of performance measure to use:
Automatic: Let Varicent AI make the decision for you.
Accuracy: How often the model is correct about which class it predicts.
Area under the curve: The area under the curve (AUC) is the measure of the model's ability to separate two values. The higher the value, the greater the concentration of positive case in the top scores that the model produces.
Precision: How often an observation which is predicted to be this value has this value in reality.
Recall: How often the model correctly predicts observations with a given value.
Use the Speed versus Quality slider to indicate if you want speed or quality when the Classifier is working.
Under Exclude columns, select the columns that you want to exclude from the Classifier.
Select Smart exclude if you want to have Smart Exclude identify and automatically exclude columns that don't help predict the target column after you build.
Click on the tool name to rename your tool node to a meaningful name. Name your tools in a way that describes the function, not the object or the data action. For example, use “Look up rate” instead of “Join to rate table”.